Introduction
Walt Disney is an iconic American Company renown for its world-class theme parks, movies, and TV shows. The company is divided into four business units. The four strategic business units generated over $45 billion in revenue in 2013. In this study, we focus on Walt Disney Theme Parks and Resorts. The two fundamental internal factors that have significantly contributed toward Walt Disney’s success are the ability to expand both horizontally and vertically. Walt Disney has expanded its operations into different strategic market segments by presenting its brands as the best option that offers value for money. Moreover, the company has maintained a diversified portfolio that has significantly reduced the systematic risk associated with operational management. For instance, Walt Disney has a diversified brand portfolio that includes children’s brand names based on geographical location. The children’s brands have significantly minimized systematic risk since they are moderately limited in terms of geographic target.
Internal performance of Disney Theme Parks
Walt Disney theme parks are strategic business units that have contributed immensely toward profitability in the long run. For example, in 2013, Walt Disney’s theme parks contributed more than $45 billion in total revenues. Paris theme parks generated $85.7 million in revenue in 2013 alone. According to Ungson & Wong (2015, p. 14), the main driving force behind Walt Disney’s success is the ability to manage its risk portfolio effectively. The company also offers world-class services to its customers who have to lead to increased sales as they opt to visit the parks every year. Customers all over the world consider Disney theme parks as their main preferred destination. A report by AECOM Economics noted that Disney Theme parks attracted more than 132.5 million visitors across the globe. This was more than double what its main rival Universal Studio and Six Flags attracted in the same period. In 2013, Universal studio attracted 36.4 million customers globally that represents a significant increase from the previous years. However, putting this into perspective, Florida Disney’s fairytale attracted half what Universal Studio attracted all over the world. Moreover, nine out of ten of the most visited parks are operated by Disney Parks. On the other hand, Six Flags attracted 25.1 million guests in the same period which was also a significant increase compared to the previous year (Rich, 2012, p. 53).
Revenue drivers and financial analysis at Disney
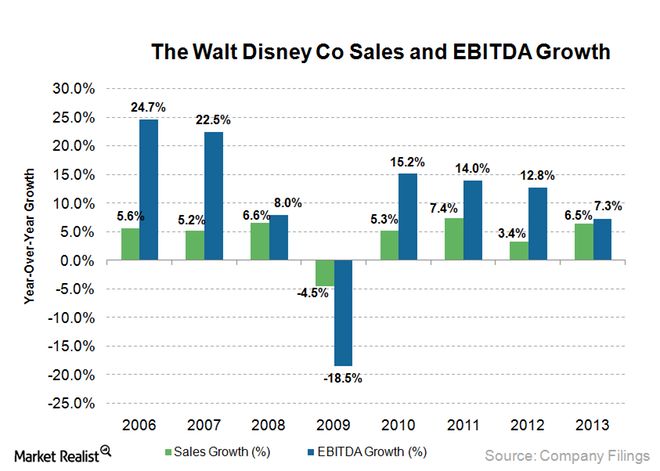
Disney Theme Parks have reported a consistent growth rate in the last six years apart from 2009 when its growth rate dwindled as a result of the global economic crisis.
Liquidity ratios
From the graph above, it is evident that Disney’s EBITDA and sales increased by 7 percent in 2013. This was driven by growth in its parks and resorts by 11 percent. Nonetheless, earnings before interest and tax declined by 7.3 percent compared to a similar period in 2012. In September 2013, the firm reported an increase in diluted EPS from $3.13 to $3.38. Total sales grew by 7 percent. On the other hand, net profit rose by 8 percent to $6.1 billion. This profit represented 45 percent contribution from Media Network followed by 31 percent by Disney Parks and Resorts. The gross profit margin has significantly increased from 22.2 percent in 2010 to 25.8 in 2013 which was driven by increased sales in the Theme Parks and Resorts. Its competitor Six Flags also has maintained a steady growth rate over the last six years. In 2013, Six Flag’s revenues increased by 12 percent to $1146 million which was majorly driven by increased accommodation revenues. This shows that Disney Theme Parks has outperformed its main competitors by a significant margin. Universal Studio reported $953 million in profit from its Parks in the same period (Ford, Sturman & Heaton, 2014). The ability of the firm to sustain profitability, in the long run, has been reflected in stock prices. Disney shares have increased by 0.68 percent to $111.50 per share in 2015 as a result of a public announcement to introduce a new product that could potentially boost future sales. According to The Street Rating team, Walt Disney shares were listed as ‘a a buy’ based on the fact that they have demonstrated strategic capability in risk management and active investment. In the first quarter of 2015, the company outperformed the industrial average by a sizable margin. Net income increased by 10 percent compared to a similar period last year. Moreover, Walt Disney has modestly exceeded the industrial average by a significant margin of 15.34 percent.
Financial analysis
Liquidity ratios evaluate the ability of Walt Disney to meet its short-term maturing obligation. From the current ratios below, Walt Disney has maintained a positive current ratio greater than one which means the company can effectively meet its current liability.
Universal studio is more liquid than Walt Disney. This means that Universal Studio is in a better position to pay current obligations than Walt Disney. However, Walt Disney has outperformed Universal Studio in quick ratios meaning the company can convert its most liquid assets into cash easily. This is true because a big portion of Walt Disney’s income is generated from service delivery that does not keep stocks.
Evaluating Walt Disney internal variables
Walt Disney’s success can be attributed to its ability to effectively manage risk and return. As a result, the company has been able to develop both horizontally and vertically.
Innovation has also contributed immensely toward Disney brand recognition which has contributed toward the rapid growth rate of the company. The firm’s ability to diversify its operations has created a substantial competitive advantage in the sense that the firm can diversify risk without losing brand recognition. Moreover, Walt Disney has effectively succeeded in accretive acquisition deals that enhance its growth rate in the long run. For instance, Disney management acquired Star Wars Company for $4.1 billion last year. The acquisition is expected to shore up not only sales in the studio operations, but also to attract more customers. Walt Disney has solid Theme Parks and Resorts which have overcome stiff competition from rivals over the past few years. Pricing has remained steady in the last four years, and the recent increase in guest attendance will likely increase future sales.
The major weakness facing Disney is the loss of income to its competitors as a result of property right violation. Although the firm has maintained a diversified portfolio, loss of income on investment as a result of piracy is a major predicament for management. Moreover, Disney has restricted its revenue drives on children. Managers need to diversify and include adults as part of their primary revenue driver since Universal Studio has expanded its sources of income to include adults. The internal analysis of Walt Disney is summarized in the internal evaluation table below.
Conclusion
Walt Disney has maintained a continuous growth rate over the last five years. Irrespective of the negative impact of the economic crisis, the firm has continued to record tremendous results. Disney’s success can be attributed to its ability to diversify risk and return. Moreover, the company has a positive current and quick ratio meaning they can effectively pay current liability as and when they fall due. The company has also succeeded in acquiring a profitable business venture that will potentially increase sales in the future.
Recommendation
Walt Disney must continue seizing opportunities when they arise in their current market segment. Moreover, the company should diversify its revenue drives to include adults. Innovation is also critical to this industry that management must identify and tap into its system. For instance, Disney should take aggressive online marketing to tap effectively into new market segments. This policy will enable Walt Disney to leverage incredibly its brand recognition globally.
References
Ford, R., Sturman, M., & Heaton, C. (2014). Managing quality service in hospitality : how organizations achieve excellence in the guest experience. Clifton Park, N.Y: Delmar, Cengage Learning.
Rich, J. (2012). The everything guide to Walt Disney World, Universal Studios, and Greater Orlando: hotels, restaurants, major attractions, and more. Holbrook, Mass: Adams Media Corp.
Ungson, G., & Wong, P. (2015). Global strategic management: a global perspective. London: Routledge.