Company Synopsis
Carphone Warehouse Group plc (CWG) was founded as a Mobile Phone retailer in the United Kingdom in the year 1989 (Carphone Warehouse Group Plc 2011). The business showed a significant organic growth and started to expand by opening different branches in the Western Europe. After Stabilization, the company started to acquire different businesses and supplemented its organic growth (Carphone Warehouse Group Plc 2012). It holds 50% and 47% shareholding in Best Buy Europe Group (Best Buy 2012) and Virgin Mobile France (Virgin Mobiles 2012) respectively, later forming a Group.
In 2006, Virgin Mobile acquired Orange network in France, which was launched as a joint venture. In the year 2007, Carphone Warehouse Group Plc. and Best Buy launched geek squad in the US and Europe. The company has its 2,400 stores open in around eight (8) different European countries with nearly 180,000 employees around the world. The Group sales are nearly 7,000,000 units annually and it holds a market share of 20% with an annual growth of 6% every year (Carphone Warehouse Group Plc 2012). Group has maintained its financial stability and is looking forward towards equity based financing (Carphone Warehouse Group Plc 2012).
Accounting Policies
Carphone Warehouse Group Plc. followed International Accounting Standards (IASs) and International Financial Reporting Standards (IFRSs) for the preparation of annual accounts for the years ending at March 2009, 2010 and 2011. All the accounts are prepared under the guidance of the international accounting standards. Summaries of the accounting treatments and policies are provided in the annual report along with proper disclosures of the transactions. Accounting Policies and standards are applied for consolidations, foreign currency transactions and translations, revenue recognition, pensions, leases, dividends, and share based payments. Carphone Warehouse Group Plc successfully covered disclosures of the major areas that are required by accounting legislations for an organization to produce a true and fair view of the financial proceedings in its annual report (Carphone Warehouse Group Plc 2009-2012).
Ratio Analysis
Liquidity Ratios
liquidity ratios are computed for gaining knowledge about the liquidity position of an organization. The limits and extents of liabilities that are covered by assets, can be estimated through these ratios (Banjerjee 2005; Moyer, McGuigan & Kretlow 2009).
The current ratio showed a sharp rise in the year 2010 because there were no cash and cash equivalents present in the previous year. The injection of cash in the year 2010 boosted the liquidity of the company but an increment in the current liabilities for the year 2011 impacted the ratio adversely and reduced liquidity by 0.27 times (Banjerjee 2005).
There are no recorded inventories and prepaid expenses in the years 2009-2011 because no such expenses incurred by the company as per its financial statements. Due to this reason both quick ratio and current ratio are appearing the same. Grounds for the hike in liquidity position are the same as discussed above for the current ratio (Banjerjee 2005).
The working capital turned positive from negative in the year 2010, covering the gap with swings. There was a minor increase in current liabilities as compared to current assets over the time due to a continuous increase in the trade payables. Current assets were increased by £100mn in 2010 due to the inclusion of cash and cash equivalents, and a continuous growth has been maintained after gaining stability in the ratio (Moyer, McGuigan & Kretlow 2009).
The working capital turnover has improved by 0.35, covering a negative balance of (0.28) in 2009 and stood at 0.07 representing a positive movement in 2010. The excessive available cash has caused the working capital to grow. In the year 2011, working capital turnover was reduced because of increased sales and increased working capital (Moyer, McGuigan & Kretlow 2009).
A liability of £397.4mn was paid off at the end of 2009 that reduced the debt ratio significantly by 47%. This was a loan from the related party and was the only huge debt of long term. In 2011, the debt ratio increased by 1% due to the increasing trade payables over the years (Banjerjee 2005).
Gearing Ratio is also called debt to equity ratio. In the case of Carphone Warehouse Group Plc., the shareholder’s equity increased and significant amount of long-term liabilities (loan from the related party) was paid off, these movements had reduced the levels of gearing of the company by 98%. The company’s inclination towards equity based financing can be noted to be high. The gearing ratio in the year 2011 increased by 1% and the reason for this increment was the increasing trend of the trade payables of the company (Banjerjee 2005).
The capitalization ratio of the year 2009 was very high because of huge liabilities of loans. In the following year, after the payment of long-term loan, the ratio was computed to be zero indicating the fact that no long–term debts exist now (Moyer, McGuigan & Kretlow 2009).
Debt to Tangible Net Worth Ratio ratio highlights the increased tangible net worth of the company over its debts (Moyer, McGuigan & Kretlow 2009).. The debts of the company reduced by the payment of a significant and material liability as discussed above that improved the tangible worth of the organization representing the value of debt against its Tangible assets (Banjerjee 2005).
Net profit margins of the company have improved since 2009 and have turned positive with highly material differences. The reduction in the interest expense and increased investment income, and income from the joint venture has improved the ratio significantly over three years.
The assets showed a positive and significant return generation in 2010, the reasons for this result is an increased positive net income that contributed in the improvement of the ratio despite assets value declined in 2010, the ratio was positive and improved. In year 2011, total assets of the company increased but the net income fell down significantly because of the low income from investments, the impact of this can be seen in the return on asset ratio that has declined by 22.07%.
Due to the increased income from investments, interest bearing activities, and sales, the income before taxes significantly improved in 2010 that in turn positively changed the value of returns on the investments (ROI) of the company in 2010. In the year 2011, net income reduced materially, which affected the earned returns on the investment (Banjerjee 2005).
The gross profit margins for all years were same, the Group has no Cost of Sales in any of the two years that’s the reason its net and gross sales are the same showing that whatever company earns it passes it on to the gross figures.
Fixed assets have shown a positive turn around over the last two years and the reasons for this improvement have been the increase in investments by the company. The fixed assets increased significantly in 2011 as compared to 2010 but a reduction in the sales has made the ratio of sales to fixed asset reduce.
Trends of Ordinary share Price
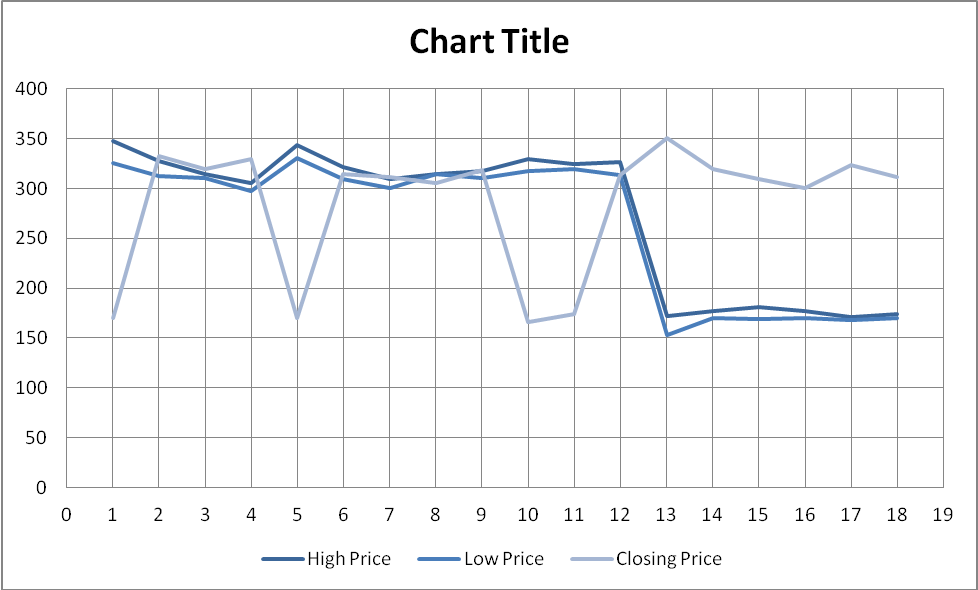
In the above figure, the horizontal axis (x) represents time period that is taken as weeks. The vertical axis (y) represents the share price in terms of pence. The high prices, low prices, and the closing prices of the company’s ordinary share in the last 18 weeks are provided in the above graph. The graph shows that the company’s ordinary share high and low prices moved constantly in a specific manner but the closing rates varied drastically after every 4-5 weeks.
Share prices have shown huge variations during the period of 18 weeks (1st November 2011 to 29th February 2012) and prices of ordinary shares appeared to be very volatile and sensitive to multiple factors. These factors made prices change vigorously over time, which surely didn’t have a good impression on the analysts and investors. Intense variations make the company’s performance and growth unpredictable and often prove to be a repellent factor for stakeholders and investors. Carphone Warehouse Group Plc’s ordinary share has reached two extreme levels of price within 18 periods, the lowest level of 150p and the highest achieved level of 350p. Unpredictability of share price can make investors avoid investing decisions in the company (ISC 2012).
Investment decision
Carphone Warehouse Group is highly suitable for any investment decision except the predictability of its stock price. The group has shown an extraordinary performance in the last 3 years; the revenues are generated from different sources like financing activities and other operations. Other graphs of the performance of group are also moving in upward direction. Cost that the company incurs annually was relatively low and it has a growth rate of 6% per annum (Carphone Warehouse Group Plc 2012).
The ratios of returns on asset, investment and equity have grown drastically and maintenance in the ratio of gross profit, net profit and operating income margins is seen. The sales to fixed assets is improved and turned positive in 2010. The group has reduced its long-term debts and turned towards equity financing solely. The debt to tangible worth has reduced that is representing the reduction in liabilities of long term and increment in the intangible assets of the company.
Group has paid up its loans and this step has taken the group out of finance costs and interest expenses. Whatever the group invests in its activities is the investment of its shareholders and whatever the business will be earning, will be distributed to the owners of the business in the form of dividends (Carphone Warehouse Group Plc 2010). Overall increase in the share price over time can be seen in the records, but with an exception of rapid fluctuations in the price (ISC 2012). This company is very ideal and can be recommended for the investment of £5mn but the investor must keep an eye on the share price movements of the company.
List of References
Banjerjee, B, 2005. Financial Policy And Management Accounting, Prentice Hall, New Delhi.
Best Buy 2012, Best Buy. Web.
Carphone Warehous Group Plc. December 23, 2011. Circular re:proposed transactions with Best Buy. Web.
Carphone Warehouse Group Plc. 2009. Annual Report 2009. Web.
Carphone Warehouse Group Plc. 2010. Annual Report 2010. Web.
Carphone Warehouse Group Plc. 2011. Annual Report 2011. Web.
Carphone Warehouse Group Plc. 2012. Carphone Warehouse Group Plc Home. Web.
Carphone Warehouse Group Plc. 2012. Company Profile. Web.
Carphone Warehouse Group Plc. 2012. Corporate Governance Committee. Web.
Carphone Warehouse Group Plc. 2012.. History. Web.
ISC. 2012. Carphone Warehouse share Price. Web.
Media Corporate. 2001. Media Corporate. Web.
Charles, M, McGuigan, J & Kretlow, W, 2009. Contemporary Financial Management, Nelson Education, Mason.
Virgin Mobiles. 2012. Virgin Mobile. Web.
Appendix
Records of Group Meetings
Circular to Shareholders for General Meeting on January 12th 2012
A general meeting was planned to be conducted to discuss matters relation to purchase transactions (Carphone Warehous Group Plc 2011). Board of directors and active shareholders attended the meeting and decision was taken by means of passing resolution.
Board meeting held on 28 January 2010
The following are the records of the board meeting held on 28 January 2010 (Carphone Warehouse Group Plc 2010), the agenda of the meeting was to finalize the terms of Nomination Committee. The nomination committee will be provided some rights and fulfill responsibilities as well.
Board of directors conducted this meeting and finalizes the criteria for the formation of Nomination committee.
Board meeting held on 28 June 2001
An annual general meeting was conducted by the chairman and director with the shareholders of Carphone Warehouse Group Plc. (Media Corporate 2001). The meeting included the presentation of audited annual financial reports to the shareholders and re appointment of Jim Dale and Adrian Martin as directors of Carphone Warehouse Group Plc. The re appointment of auditors was also decided in the meeting through an ordinary resolution.