Introduction
This paper aims to prepare a report as a financial advisor to an investor whether the Commonwealth Bank of Australia (CBA) as a public company is a suitable investment. The paper would attempt to evaluate the balance sheet and income statement of the company whether the company is financially stable and growing. This would also examine the liquidity and profitability of the company and whether it can match with its competitors in the market. The paper will explain the interconnection of the ratios and how these ratios link the investor to a global understanding of the firm and what the calculations mean. The paper will then make a recommendation on whether the investor should invest in the company based on the analysis made.
Analysis and Discussion
Overview of the selected company
This paper has chosen the Commonwealth Bank of Australia (CBA) which is in the business of providing financial services, including business and institutional banking, retail, life insurance, superannuation, brokering services, and fund management. CBA’s extensive services explain its operation in seven segments which include Business and Private Banking, Retail Banking Services, Wealth Management, Institutional Banking and Markets, International Financial Services, and BankWest and Others. It has foreign international operations including those from New Zealand, the United States, the United Kingdom, Japan, Singapore, Malta, Hong Kong, Grand Cayman, Fiji, Indonesia, China, and Vietnam.
Financial Ratios and their implications
The following summary of financial ratios is extracted from the financial statements of CBA as against industry averages to facilitate comparison analysis in terms of profitability, efficiency liquidity, and capital adequacy.

Financial Leverage or Capital Adequacy
In finance, solvency or leverage like liquidity has also something to do with the ability of an enterprise to pay its debts with available funds like cash which is presumed to exist. It is however different from liquidity since solvency must be long term or it must speak for the financial stability of the company to survive short term problems by having sufficient capital investment from stockholders to match the long term debt of the company together with currently maturing obligation. Banks expressed their solvency using the term “capital adequacy ratio”, where the capital of the bank is being related to the total risk faced by the bank.
This capital takes the function of a numerator in computing the ratio and which them into Tier 1 capital and Tier 2 capital. Tier 1would allow the bank to absorb losses without stopping to trade while Tier 2 capital allows ban losses to be absorbed in case of dissolution or winding up of the bank. It must be interpreted that there is greater protection of depositors if Tier 1 exceeds Tier 2. An adequate capital for a bank like CBA would include its capacity as well to face its credit risk, operational risk, and market risk. Solvency in non-banks as expressed in the debt-equity ratio would be viewed more objectively in using the Capital adequacy ratio because of different levels of risks in banks.
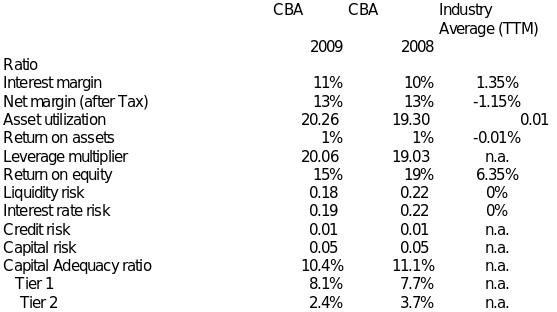
Applying the knowledge in the case of the company, the capital adequacy ratio for CBA is 10.4% in 2009 from 11.1% in 2008. Please refer to Table A. The standard to use in evaluating the company’s capital adequacy or leverage is whether it complied with international standards under Basel Accord. Thus compared with the requirement of at least an 8% capital adequacy ratio, CBA may be declared or considered as solvent banks which could face its risks from an international context. The capital adequacy ratio declined from 2008 to 2009 as the company was able to provide a very big dividend during 2009 amount to $3.7 billion. There could be no issue raised as to the propriety of giving large dividends to stockholders with the possible implication of neglect to other stakeholders.
CBA was very proud to have provided support to its more than 10 million customers. Such is considered an achievement is considered by CBA’s management to have a meaningful contribution to the community. With its capacity to have employed more than 37 million people in Australia, the company could be considered to be very important in helping the economy of Australia in promoting employment of its people as compared to lay-offs of loss of employment from other countries like the United States during 2008. The company is still committed to providing employment and promises not to undertake off-shoring for at least three years from 2009. Since it has a wide base of domestic shareholder numbering about 800,000 who holds 80% of the share of the Company, CBA may have well pleased its stockholders in 2009. Such would be a great attraction to contemplate investing with the company.
Leverage is also a different concept from profitability, as the latter pertains to the ability of a company to earn a profit so that the business entities would improve their leverage. In certain situations, however, capital owners or stockholders may just inject funds to make the capital of acceptable leverage. But investors could not be expected to be always doing the same since the opposite must rather prevail- that is investors must receive dividends or increase the price of their stock investments as an indication that they are earning from the company that would cause them to support the company. To attain this objective, a business must generate sufficient profits above its cost of capital. Profitability, however, will be analyzed further in the latter sections after discussing liquidity in the next subsection.
Liquidity
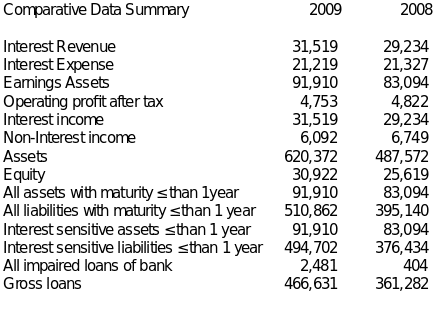
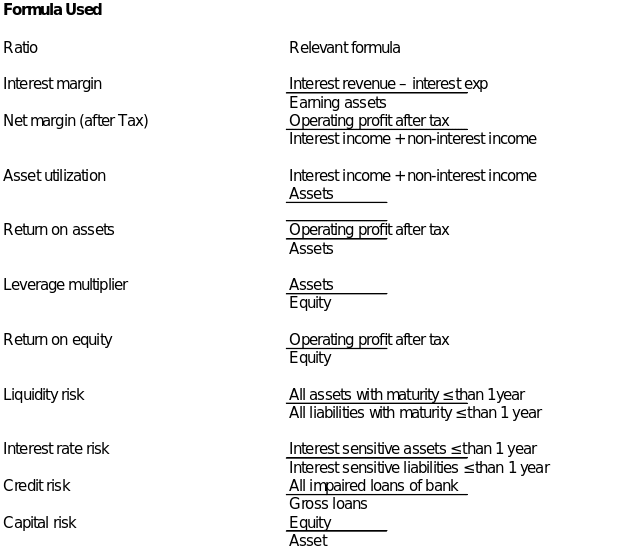
Business entities including banks need to be liquid to meet their maturing obligations in the short term. In non-banks liquidity is expressed or measured in current ratios and quick ratios rations. In comparison, liquidity in banks could be measured by liquidity risk and interest rate risks. Liquidity is computed by dividing all assets with a maturity of 1 year or less is divided with all liabilities with a maturity of 1 year or less. See Appendix II. On the other hand, interest rate risk is derived by dividing interest-sensitive assets of 1 year or less by Interest sensitive liabilities of 1.0 years or less.
In terms of liquidity risk, CBA reflected 0.18 in 2009 from 0.22 in 2008. This indicates deterioration from the previous year. This also means that CBA is less liquid than what is expected from a non-bank to have a current ratio as an equivalent way of measuring liquidity. The same behavior of the company’s liquidity may be observed in terms of interest rate risk. CBA’s interest rate risk reflected a lower rate at 19% in 2009 compared to 22% in 2008. Likewise, this indicates deterioration from the previous year. This could be explained by the effect of the US recession that was still felt in Australia. See Table A above. Ordinarily decline in liquidity could be a reflection of poorer profitability performance in 2009 compared to the previous year. As to whether there is a basis for this one will be verified later in the analysis for profitability in the next section.
In comparing interest rate risk from liquidity, it may be noted that interest rate risk is a more focused measure for liquidity since the same includes only interest-sensitive assets and liabilities within one year period or less while liquidity risk includes assets and all liabilities within one year period or less. It may be observed however that the results of the profitability analysis appear to create some inconsistency in the resulting liquidity risks and interest rate risks of CBA.
The ratio of liquidity risk or interest rate risk should be ideally at least one since this would mean that a company must be able to match 1 dollar from its liquid assets to every dollar of its currently maturing obligations in one year or less. Failure of a company to do this could mean bankruptcy and may force the company to stop operation. This must be so since the salaries of its employees, who must come to work, must be paid every payday as they cannot wait longer to have their living expenses not paid on time.
Applying the principle, CBA may be noted that its liquidity risk and interest rate risk for 2009 and 2008 were both less than 1.0 which should indeed paint weak liquidity when compared with an ordinary non-bank company. However, a company like CBA from the banking industry could still be considered as having an acceptable level of liquidity as its liquidity could be more easily increased in a shorter period compared to non-banks and that the increased regulation for banks regulated than non-banks should assure depositors of its liquidity.
Compared with the industry average of cannot be done in this paper lack of data (Reuters.com, 2009b). This absence could indicate that CBA may still be considered liquid since that is more controlling is the capital adequacy ratio for which CBA has complied. Moreover, what international standard requirements include the Tier 1 capital which would allow Tier 1would allow the bank to absorb losses without stopping to trade, an indication that compliance could suggest the capacity to meet liquidity requirements. This must be so since banks could be prohibited from investing heavily in non-liquid investments because of the nature of their business.
Profitability and Efficiency
CBA’s profitability is higher than the industry average. Based on interest margin for the years 2009, CBA had 11% as compared with 2008 at 10% while the industry average was 1.35%.. The same behavior may be observed in terms of net margin where CBA had 13% in 2009 which remain unchanged from 2008 as against the industry average of negative 1.15%. The fact that the net margins for CBA compared are higher with interest margin means for 2009 and 2008 would indicate higher non-interest income as a complement from their interest incomes which thereby increased their operating profit after tax about their total assets. This would mean that the bank has increased earnings from non-interest income sources. See Table A.
When viewed in terms of absolute Australian dollars as CBA earned only $31.5 million in net interest revenue or income in 2009 as compared to $29.2 million in 2008. From the point of view of any analyst, the ratios would be better measures of profitability since the data are standardized or converted into rates. CBA therefore may be declared to be profitable. For purposes of comparing the CBA’s interest margin against the industry average for the latest trailing-twelve-month ratios of the banking industry is used. See Table A.
The same better profitability is however not observed in terms of Return of Equity (ROE) where CBA showed 15% for the years 2009, which is lower than the prior year of 19%. Despite the decline, a 15% rate is still too high since it would mean that for every hundred dollar investment with the company, the same investor could expect to earn 15 dollars. When compared to many parts of the world, attaining such high ROE when other companies in the US were suffering a decline because of recession. In terms of Returns of Assets (ROA) CBA posted at 1% for the years 2009 and 2008 which would show a similar level of efficiency for both banks during the two years.
While ROA measures how efficient management of a company in terms of assets employed in business, ROE measures how much management is compensating resources invested by stockholders. By comparing the two ratios, it would seem that the management of CBA has shown leverage in using its assets since its ROE’s is higher than its ROA which is indicative that the management of CBA showed better performance as well in 2009 compared to 2008.
The profitability of CBA is further confirmed when compared with the rest of the banking industry. The ratios indicate that while the rest of the firms in the industry were
experiencing negative or low profitability/efficiency industry ROA of negative 0.01%, industry ROE of 6.35%, CBA was doing better, than the rest of their competitors. See Table A. The company’s showing could indicate resiliency in the face of a crisis that was affecting many parts of the world.
Compliance with International Banking Standards
Banks in Australia are required to comply with Basel II Accord, which refers to banking supervision effective in 2008 in Australia. This means that an investor of a bank in Australia is comparing it with the rest of the banks in the whole world in terms of risk and profitability. The accord uses a different way of computing the capital adequacy ratio from the previous requirement of the monetary authority in Australia and one of the pillars of the Basel Accord is that the total capital ratio should not be less than 8% and the Tier 2 capital is limited to 100% of Tier 1 capital. As stated earlier, CBA complied with the Basel requirements and it may be declared to have sound financial leverage.
Conclusion
CBA was found better than its average competitors in the banking industry using industry average ratios in terms of profitability and efficiency. Better profitability and efficiency of CBA did result in better liquidity and leverage in 2009 compared to 2008 and that the company was found complying with the requirements with the international standards on banks under Basel Accord. From the point of view of the investor, the stock of CPA may be considered a good investment option. Given the very high profitability of the company, investors may gladly put their money with the bank, and should the bank plan for expansion, it has greater chances of generating capital by selling stocks to the public compared to competitors.
Although the bank was found to have lower than 1.0 liquidity the same should be a cause for alarm since what is controlling in banks is the capital adequacy ratio which also measures the degree of leverage that would allow the banks to face different risks associated with the banking industry.
Appendix I

Appendix II

Works Cited
Bank for International Settlements. “Part 2: The First Pillar? Minimum Capital Requirements”. (n.d.). Web.
Commonwealth Bank of Australia Annual Report for 2008 of CBA, (2009). Web.
Mullineux and Murinde. Handbook of international banking. Edward Elgar Publishing, 2003.
Reuters. Industry ratios. (2009b). Web.
Reuters. Company Profile of CBA. (2009a). Web.

