Contribution Margin: Wonder Co. Case

The pricing strategy and pricing principles that would allow the firm to meet its objectives effectively are being developed in parallel, and working on a pricing strategy is a long-term economic process because it is impossible to create a plan that could then be used for many years. The pricing strategy is dynamic, it should be continuously reviewed based on actual results and, if necessary, adjusted according to the current market conditions (Gallo, 2017).

The development of pricing policy and strategy of the company involves carrying out several works and calculations. Firstly, the optimal cost of production and marketing of the company’s products is calculated. Secondly, the value of the enterprise’s products for potential buyers is determined (the consumer properties are defined) and the measures for substantiation of the price level correspondence to their consumer properties are taken (Gallo, 2017). Thirdly, it is projected the sales volume of the product, or the market share for the enterprise for which production, will be most profitable.

The process of pricing strategy development consists of three stages.

  1. Gathering baseline information: cost estimation, refinement of financial goals, identification of potential buyers, improvement of marketing strategy, identification of potential competitors.
  2. Strategic analysis: business analysis, market segment analysis, competition analysis, state regulation impact assessment.
  3. Strategy formation: setting the final pricing strategy. Price strategies are incredibly diverse. The feasibility of applying each of them is determined, first of all, by the goals of the pricing policy, as well as by what pricing guidelines the firm has chosen for itself: production and sales costs, consumer demand, price policy of competitors.

Company Performance Summary

During the simulation, the price strategy for all three product categories was changed. The avoidance of prior mistakes and the review of CVP analysis indicates that the W1 product’s price should be decreased to $280 to capture more consumers. The R&D for this market can also be reduced due to the consumers’ preferences. In this case, R&D becomes 25%.

The price for W2 should be $490, with 38% of R&D investments. The W3 product requires a price increase to $190 for higher revenue and more investments in R&D (up to 37%). Such steps are essential for the 2013 strategy, as they set up a growth tendency for both revenues, profits, and market performance.

Variable Name 2012
Revenue
Total Sales $ 1 531 940
Revenue $ 523 298 924
Cost
Variable Costs $ 300 161 138
Fixed Costs $ 112 500 000
R&D Costs $ 24 000 000
Total Costs $ 436 661 138
Profit
Total Profit $ 86 637 786
Profitability 17%
Contribution Margin $ 223 137 786
Contribution Margin Ratio 0,7
Break Even Point
In Dollars $ 300 161 138
Contribution Margin $ 223 137 786
Contribution Margin Ratio 0,7
Target Income
Target Operating Income $ 110 637 786
Required Income in Sales $ 448 989 198

Table 1: Wonder Co. Revenue and CVP in 2012.

2014 2015 2016
$ 4 033 114 $ 4 033 114 $ 2 774 362
$ 1 459 156 714 $ 1 459 156 714 $ 1 092 607 224
$ 782 868 555 $ 782 868 555 $ 576 867 316
$ 150 000 000 $ 150 000 000 $ 150 000 000
$ 24 000 000 $ 24 000 000 $ 24 000 000
$ 956 868 555 $ 956 868 555 $ 750 867 316
$ 502 288 160 $ 502 288 160 $ 341 739 908
34% 34% 31%
$ 676 288 159 $ 676 288 159 $ 515 739 908
0,9 0,9 0,9
$ 782 868 555 $ 782 868 555 $ 576 867 316
$ 676 288 159 $ 676 288 159 $ 515 739 908
0,9 0,9 0,9
$ 526 288 159 $ 526 288 159 $ 365 739 908
$ 1 392 097 691 $ 1 392 097 691 $ 985 956 075

Table 2: Wonder Co. Revenue and CVP in 2014-2016.

Product W1 Analysis

Variable Name 2012 2016
Sell Price $ 285 $ 280
Revenue
Total Sales $ 968 979 $ 823 995
Revenue $ 276 159 075 $ 230 718 646
Cost
Variable Costs $ 145 346 882 $ 123 599 275
Fixed Costs $ 75 000 000 $ 75 000 000
R&D Costs $ 10 000 000 $ –
Total Costs $ 230 346 882 $ 198 599 275
Profit
Total Profit $ 45 812 193
Profitability 17%
Variable Name 2012 2016
Customer Base
Installed Base 1 035 000 6 728 771
Remaining Customers 6 000 000 306 229
Market Saturation 15% 96%
Sales Volume First Time Customers 882 729 306 229
Repeat Sales 86 250 517 766
Total Sales 968 979 823 995
Contribution Margin $ 130 812 193 $ 107 119 371
Contribution Margin Ratio 0,9 0,9
Contribution Margin per Unit $ 256 $ 243
Break Even Point
In Units 509 989 441 426
Fixed Costs $ 130 812 193 $ 107 119 371
Contribution Margin per Unit 256 243
In Dollars $ 145 346 882,00 $ 123 599 275,00
Fixed Costs $ 130 812 193 $ 107 119 371
Contribution Margin Ratio 0,9 0,9
Target Income
Target Operating Income $ 55 812 193 $ 32 119 371
Required Income in Sales $ 207 360 430 $ 160 660 088
Required Income in Units 727 580 573 786

Table 3: Product W1 Analysis.

The strategy for W1 was changed. The price was decreased to cover more consumers on the market. Each year the R&D investments were reduced to allocate them for more promising W2 and W3. In this case, the product reached market saturation in 2015, when its R&D reached 0% from the company’s performance. As a result, the maximum possible gain was accomplished.

Product W2 Analysis

Variable Name 2012 2016
Sell Price $ 439 $ 500
Revenue
Total Sales $ 562 961 $ 1 572 718
Revenue $ 247 139 848 $ 786 358 846
Cost
Variable Costs $ 154 814 256 $ 432 497 365
Fixed Costs $ 37 500 000 $ 37 500 000
R&D Costs $ 14 000 000 $ 10 800 000
Total Costs $ 206 314 256 $ 480 797 365
Profit
Total Profit $ 40 825 593 $ 305 561 481
Profitability 17% 39%
Variable Name 2012 2016
Customer Base
Installed Base 550 000 5 047 577
Remaining Customers 6 000 000 1 502 423
Market Saturation 8% 77%
Sales Volume First Time Customers 516 018 1 153 609
Repeat Sales 46 943 419 109
Total Sales 562 961 1 572 718
Contribution Margin $ 92 325 592 $ 353 861 481
Contribution Margin Ratio 0,6 0,8
Contribution Margin per Unit $ 262 $ 409
Break Even Point
In Units 352 652 864 995
Fixed Costs $ 92 325 592 $ 353 861 481
Contribution Margin per Unit 262 409
In Dollars $ 154 814 256,00 $ 432 497 365,00
Fixed Costs $ 92 325 592 $ 353 861 481
Contribution Margin Ratio 0,6 0,8
Target Income
Target Operating Income $ 54 825 592 $ 316 361 481
Required Income in Sales $ 246 747 414 $ 819 161 397
Required Income in Units 562 067 1 638 323

Table 4: Product W2 Analysis.

The product W2 strategy was based on the continuous increase in both price and R&D investments. In this case, the 2013 price was set at $490, while R&D got 38%. The company maximized profits and performance of the product. Nonetheless, the 2015-2016 period became a failure, as the strategy could be executed better. Even though the approach did not show the best performance, in the end, the company gained maximum profitability from W2 before saturation.

Product W3 Analysis

Variable Name 2013 2016
Sell Price $ 190 $ 200
Revenue
Total Sales $ 154 709,00 $ 377 649,00
Revenue $ 29 394 732,00 $ 75 529 732,00
Cost
Variable Costs $ 8 509 001,00 $ 20 770 676,00
Fixed Costs $ 37 500 000,00 $ 37 500 000,00
R&D Costs $ 7 920 000,00 $ 13 200 000,00
Total Costs $ 53 929 001,00 $ 71 470 676,00
Profit
Total Profit $ -24 534 269,00 $ 4 059 056,00
Profitability -83% 5%
Variable Name 2013 2015
Customer Base
Installed Base 340 000 915 893
Remaining Customers 17 500 000 16 924 107
Market Saturation 2% 5%
Sales Volume First Time Customers 132 241 321 216
Repeat Sales 22 468 56 433
Total Sales 154 709 377 649
Contribution Margin $ 20 885 731 $ 54 759 056
Contribution Margin Ratio 2,5 2,6
Contribution Margin per Unit $ 466 $ 527
Break Even Point
In Units 44 784 103 853
Fixed Costs $ 20 885 731 $ 54 759 056
Contribution Margin per Unit 466 527
In Dollars $ 8 509 001,00 $ 20 770 676,00
Fixed Costs $ 20 885 731 $ 54 759 056
Contribution Margin Ratio 2,5 2,6
Target Income
Target Operating Income $ -16 614 269 $ 17 259 056
Required Income in Sales $ 1 740 225 $ 27 317 214
Required Income in Units 9 159 136 586

Table 5: Product W3 Analysis.

The W3 product price strategy is based on the moderate increase in the price in the 2012-2013 period from 185 to 190. In this case, the product is valued following the market competition. R&D investments are continuously growing to increase performance and attract more clients. As a result, the 2015-2016 period becomes profitable for the company, which is far better than the former manager and approaches have provided. Nonetheless, the weak points in 2015-2016 could be improved by making more accurate projections and product performance analysis.

Recommendations

The analysis of strategic decisions shows that the company could perform better on the market if the following steps are taken:

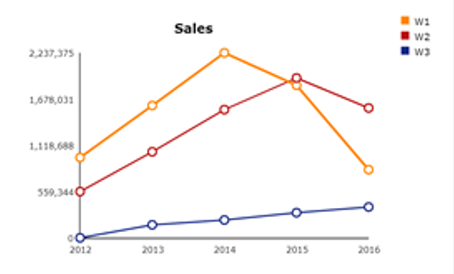
  1. The W1 product R&D should be 0% in 2014, while the product should be disjointed in 2015 to avoid significant damages for the revenue statement (see Chart 1).
  2. The W2 product should not be supported after 2015 to avoid financial losses, as the product has already reached the market saturation and stake out (Gallo, 2017).
Wonder Co. Revenue Curve.
Chart 1: Wonder Co. Revenue Curve.

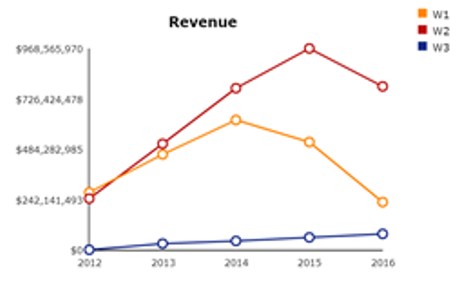
The rationale for these actions can be found on the sales curve, which represents the market performance of all three products. In this case, the company should accurately forecast changes on this curve, which cannot be done only by CVP analysis (Gallo, 2017). Saturation factors and consumer base should be also scanned to identify possible period before the stake out.

Wonder Co. Sales Curve.
Chart 2: Wonder Co. Sales Curve.

References

Gallo, A. (2017). Contribution Margin-What It Is, How to Calculate It, and Why You Need It. Harvard Business Review, 1-3. Web.

Cite this paper

Select style

Reference

BusinessEssay. (2022, December 16). Contribution Margin: Wonder Co. Case. https://business-essay.com/contribution-margin-wonder-co-case/

Work Cited

"Contribution Margin: Wonder Co. Case." BusinessEssay, 16 Dec. 2022, business-essay.com/contribution-margin-wonder-co-case/.

References

BusinessEssay. (2022) 'Contribution Margin: Wonder Co. Case'. 16 December.

References

BusinessEssay. 2022. "Contribution Margin: Wonder Co. Case." December 16, 2022. https://business-essay.com/contribution-margin-wonder-co-case/.

1. BusinessEssay. "Contribution Margin: Wonder Co. Case." December 16, 2022. https://business-essay.com/contribution-margin-wonder-co-case/.


Bibliography


BusinessEssay. "Contribution Margin: Wonder Co. Case." December 16, 2022. https://business-essay.com/contribution-margin-wonder-co-case/.