About Cummins Inc
Cummins Inc is a multi-billion dollar diesel engine manufacturer that started its journey in 1919 from Indiana, USA and now it is a global giant in at least four business areas like engine, power generation, and distribution power tools around 190 countries with 44,000 employees and 6,500 dealer locations with an annual sales revenuer of 18.0 billion. Besides the diesel generating sets, the company manufactures natural gas engines, heavy-duty trucks, buses, light-duty sports automotive and recreational cars, agricultural equipment nuclide marine engine and rail, heavy construction tools, oil gas and mining equipment the company provides emission solutions, turbo technologies, filtration technologies, fuel systems with a potential market demand if the products all over the world.
Cummins is also the global leader for planning and designing emission solutions systems integrating with custom engineering requirements in the market, while it’s raising market demand for turbo technologies leads the company for tactical production in five different countries, and the company has been serving the filtration market with over 7000 varieties of filters and chemicals. The most prevalent fuel systems business of Cummins Inc has a global reputation with a sustainable growth rate of the company without any major crisis, but the sector that the company serves have seriously affected by the global financial crisis with sensitivity to changes in the interest rate and falling market demand for both heavy and light equipment.
Company News
Jackson and Anthony (1) reported in the Bloomberg Businessweek that machinery stocks are attracting investors because the stocks have “meaningful upside potential” and the companies are now overcoming the adverse situation of global economic downturn, for example, medium-sized 55 firms had risen 9.4% with a loss of 0.8% in the S&P 500 index. They further addressed that investors will use these stocks for the long-term growth prospects because this industry will observe excellent success near future due to increasing demand, which positively influences the global brand Cummins Inc to gain profit margin.
Although the financial ratios of the company were quite attractive in 2011, one latest news provided by the Wall Street Journal states that Cummins Inc’s third-quarter profits declined by twenty-two percent; according to Tita (1), the earnings fell due to a worsening North American truck market and poor income from global markets. In addition, it is highly essential to consider the fact that Cummins’ turnover came below analysts’ hopes; nevertheless, it sustained its revised forecast for 2012.
Stock Market Activity
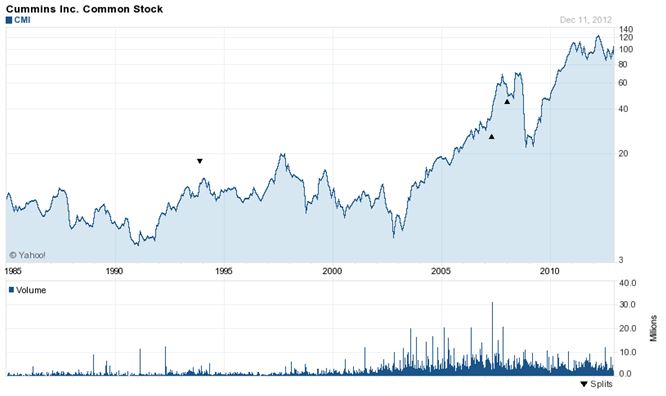
The stock price chart of Cummins Inc (CMI) below demonstrates that the share price was in a stable position is situated in a specific range and it had decreased in the global financial crisis in 2008 dramatically like other competitors; in addition, it had not experienced financial success in that period; however, the following figure shows the position of the company in the Stock market –
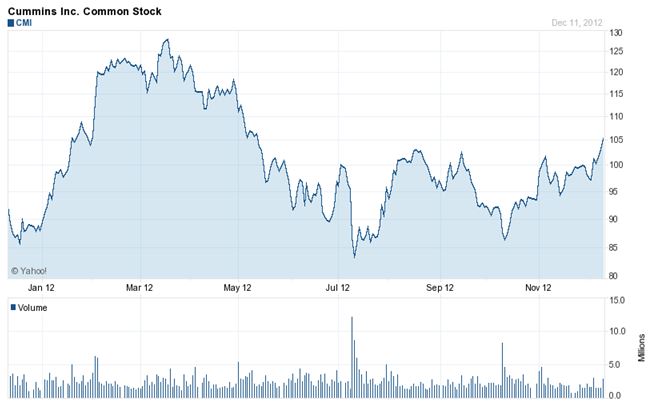
Most important the performance of Cummins Inc in the Stock market in 2012 is satisfactory while the share price increased from $101 to $86.97 within the last three months and this price is increasing day-by-day especially its share price increased significantly from Dec 6, 2012; however, the following figure depicts present year’s performance of Cummins Inc –
Here, it is important to mention that the position of Cummins in the stock market is much better than the competitors’ position, for instance, the stock price performance of Navistar International Corporation is falling day-by-day; however, the subsequent figures show more clearly –
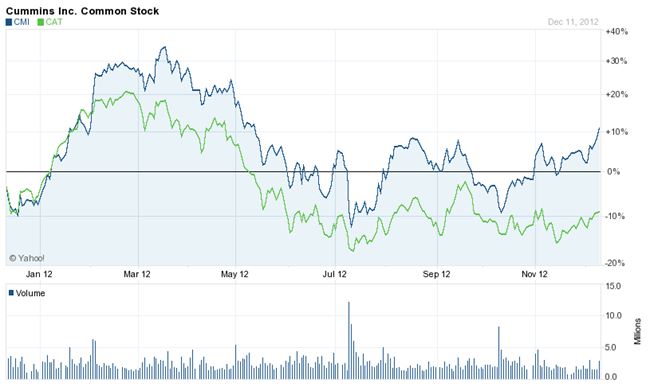
Table 1: Divided. Source: Yahoo Finance (1).
Financial Statement Analysis
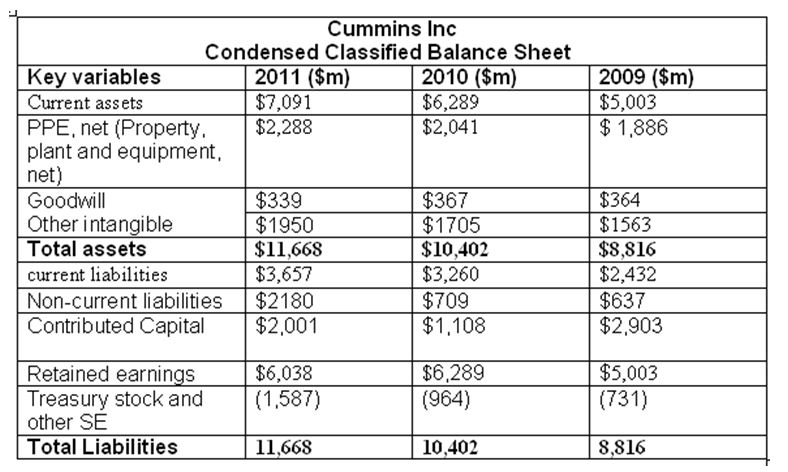
Condensed Classified Balance Sheet
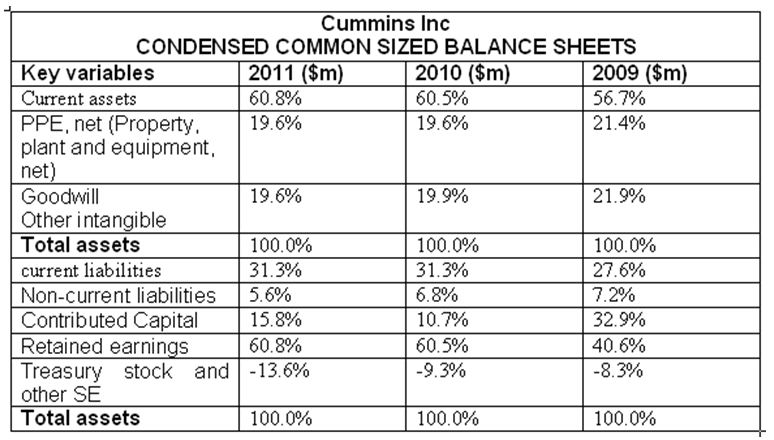
Common Sized Balance Sheets
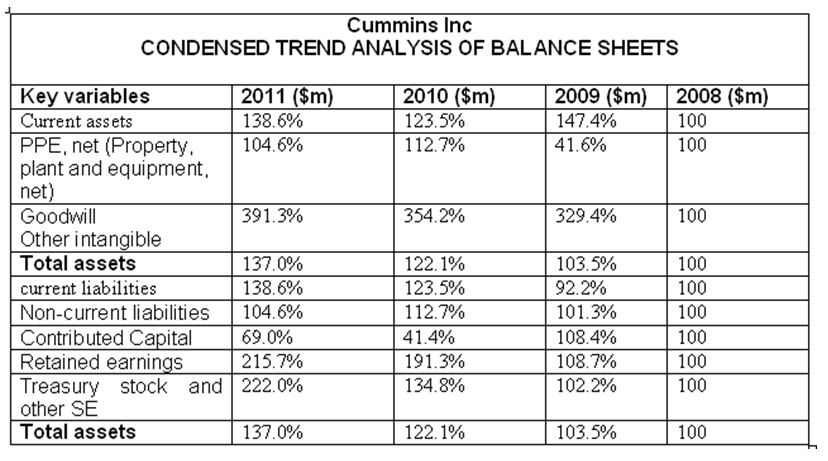
Trend Analysis of Balance Sheets
Analysis and Review of the Balance Sheet
From the balance sheet of the company, it can be argued that the current assets have grown tremendously throughout 2009, 2010, and 2011 gradually, indicating a very positive trend for Cummins Inc. In addition, it is highly optimistic to note that the Property, plant, and equipment, net (PPE) is also showing a rising trend from 2009 to 2011, which is a very positive factor because this indicates that Cummins Inc is investing a bit in the hard assets of its business. On the other hand, other intangibles are going up slowly but surely, from $1563 in 2009 to $1705 in 2010, to $1950 in 2011, which is again a good thing for the company.
However, it is important to state that the fact that the goodwill of Cummins Inc has lowered from $367 in 2010 to $339 in 2011, is truly an alarming factor for the reputation of the company. In addition, the fact that the company’s current liabilities are increasing slowly but surely from $2,432 in 2009 to $3,260 in 2010, to $3,657 in 2011 is also a very troubling thing for Cummins Inc. On the other hand, increasing non-current liabilities from $637 in 2009, to $709 in 2010, to $2180 in 2011 is also an alarming factor (Cummins 65).
Income Statement
Analysis and Review of Condensed Income Statement
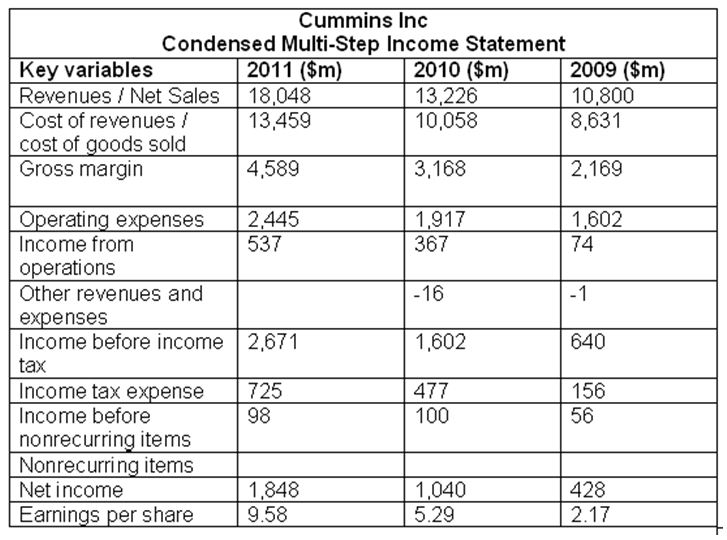
The condensed income statement shows that sales review of this company increased $4822 million from the year 2010; at the same time, costs of goods sold enlarged $3401 million from the previous year (Cummins 70). On the other hand, the operating expenses along with a net profit of Cummins Inc increased significantly, for instance, operating costs boosted $1917 million to $2445 million within one year of its operation; moreover, the net profit of 2010 was $1,848 million, which was $1040 million in 2009; therefore, EPS reach around 9.58 (Cummins 65).
Condensed Multi-Step Income Statement
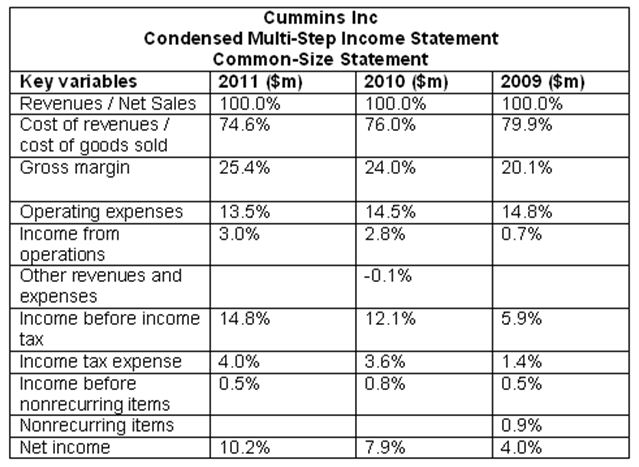
Analysis and Review of Common-Size Statement
Common-Size Statement shows that cost of goods sold was 74.5% and gross margin was 25.4% for the year 2010 while in 2011, these figures were 76% and 24% accordingly. Net income was 10.2% in 2010 since the percentage of operating expense decreased in 2010 though income tax expense increased slightly, which indicates that the Cummins is in a suitable economic environment to experience annual growth; moreover, it has a strong presence in the financial, so, the investors are now confident to invest more for the future development.
Trend Analysis
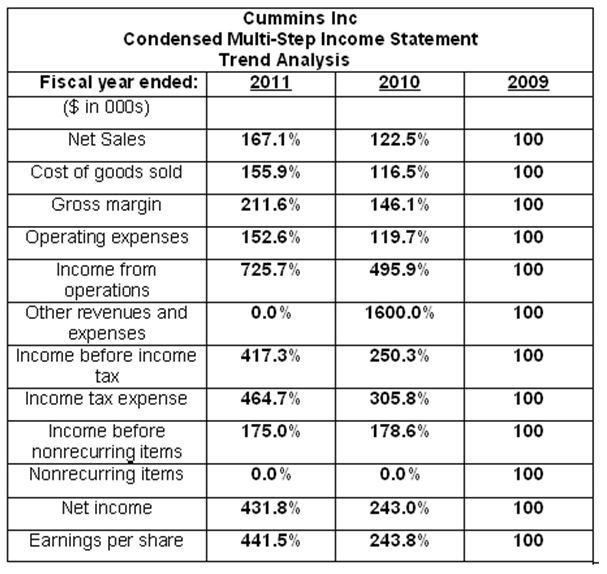
Analysis and Review of Trend Analysis of Income Statement
As per the above table, the trend of net sales is increasing; at the same time, the company experienced outstanding success while the percentage of net income is 441.5%.
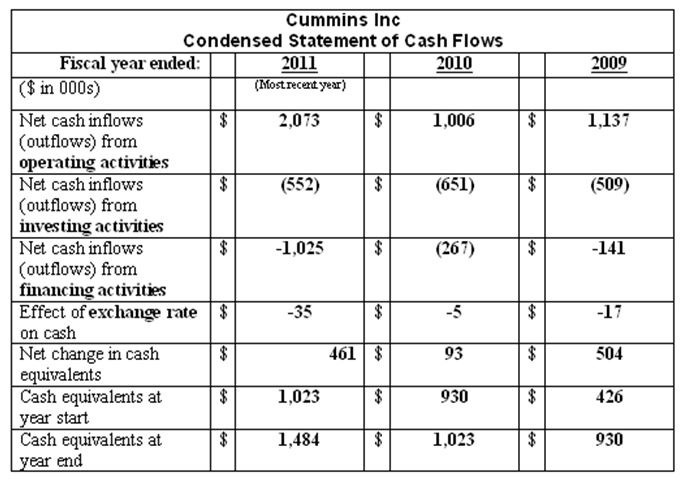
Analysis and Review of the Cash Flows
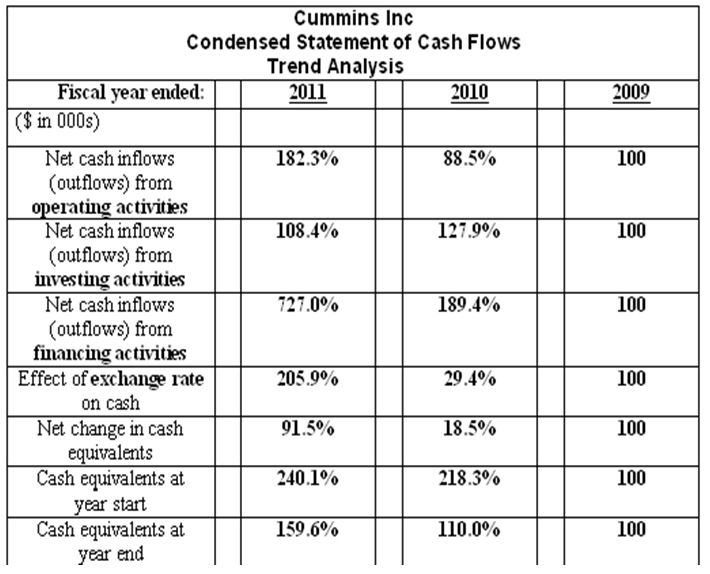
From the analysis and review of the cash flows of Cummins Inc, it can be said that the flow of cash and cash equivalents were quite healthy in 2011 than the previous year, due to the reason that the cash inflow of the company was higher than the cash outflow. In addition, whilst cash equivalents at year start were $ 1,023, cash equivalents at year-end are $ 1,484, which also indicates more positive cash circulation than the previous year.
Condensed Cash Flows Statement
Trend Analysis
Analysis and Review of Trend Analysis of Cash Flows Statement
Trend analysis shows the positive position of this company in the market, and this will influence the investors and encourage internal employees to develop the company.
Ratio Analysis
The following are the additional data needed for ratio computations
Return on Sales
Table 8: Return on Sales of Cummins Inc. Source: Self generated.
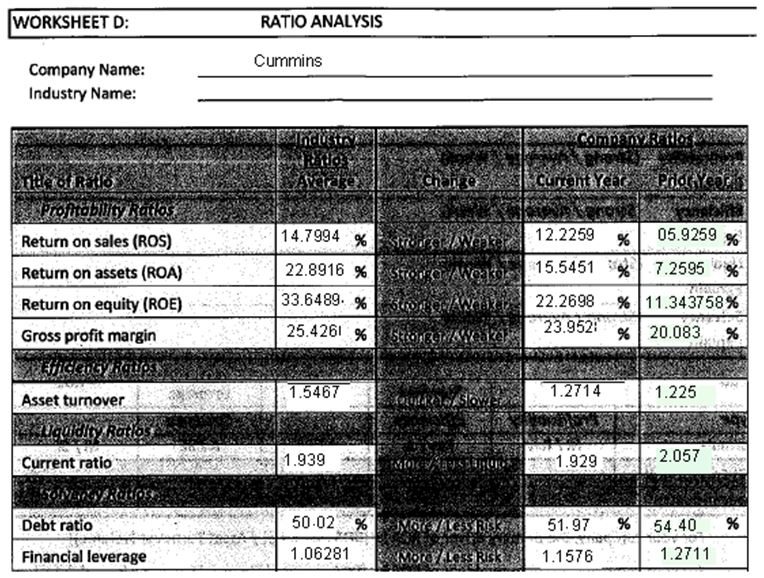
Return on Sale gives an insight into how much profit is being produced per dollar of sales; from 2009 to 2011, ROS of the company increased consecutively from 05.9259 in 2009, to 12.2259 in 2010, to 14.7994 in 2011; a rising Return on Sales points that Cummins is turning additionally efficient, whereas a declining ratio may mean threatening fiscal problems.
Return on Assets
Table 12: ROA of Cummins Inc. Source: Self generated.
From 2009 to 2011, the return on assets (ROA) of the company increased consecutively from 7.2595 in 2009, to 15.5451 in 2010, to 22.8916 in 2011. On the other hand, it is arguable that ROA is a meter of how lucrative a corporation is (comparative to its total assets), and increasing ROA gives an idea that the firm is competently handling its assets to engender earnings; as there is a great change in the Return on Assets ratio of the company; therefore, this ratio indicates a quite attractive position of the business at present.
Return on Equity
Table 12: ROE of Cummins Inc. Source: Self generated.
From 2009 to 2011, the Return on Equity (ROE) of the company increased consecutively from 11.34375828 in 2009, to 22.2698 in 2010, to 33.64894392 in 2011; however, where the Return on Equity is superior to the business’s ROA, then it is an indication that Cummins’ administration is using leverage to boost profits; so the profitability of the firm is very strong.
Debt Ratio
Table 10: – Debt Ratio. Source: – Self generated.
The table above shows that from 2009 to 2011, the Debt Ratio of the company decreased consecutively from 0.5440 in 2009, to 0.5197 in 2010, to 0.5002 in 2011; it is noticeable that a firm with a higher ratio is considered riskier than one with a lower ratio, this seems to be a positive and strong side of the business. It is important to state that debt ratio shows the monetary leverage or authority of a corporation; in addition, it calculates what proportion of the general business assets are possessed by the equity and debt; however, the investors in debt favor this sort of ratio, as it assists them to identify what coverage is there at the time of bankruptcy.
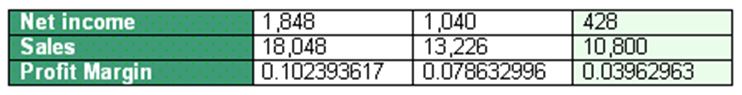
Net Profit Margin
High net profit margin ratio shows how successful the firm is at changing sales into profit, and that the firm is capitalizing on some competitive advantage, which can give it some additional capability and suppleness throughout the difficult financial periods; as Cummins’ NPM increased from 0.039629630 to 0.102393617, in 2011 the company’s overall profitability was strong. Moreover, the Return on Equity (ROE) of the company indicates that the profitability of the firm is very strong.
Gross Profit Margin
The following table analyses the Gross Profit Margin of the company; however, part F discusses this in more detail:
Table 12: Gross profit margin of Cummins Inc. Source: Self generated.
Current Ratio
The current ratio is a common and quick assessment of liquidity of Cummins, as it shows the margin of safety or cushion accessible to the creditors; moreover, it is an index for Cummins Company’s financial stability and practical solvency and a directory of the strength of its working capital. From 2009 to 2011, there has been a sudden decrease in the current ratio of Cummins Company (2.057 in 2009, 1.929 in 2010, and 1.939 in 2011). The following table analyses the Current Ratio of the company; nevertheless, part F discusses this in more detail:
Table 7: Working Capital and Current Ratio of Cummins Inc. Source: Self-generated.
Asset Turnover
The table below investigates the Asset Turnover of the company; nevertheless, part F has detailed analyses on this:
Table 13: Total assets turnover. Source: Self-generated.
Financial Leverage ratio
The table below examines the Financial Leverage ratio of the company; however, part F has detailed analyses on this:
Table 10: Financial Leverage or Debt Equity Ratio. Source: Self generated.
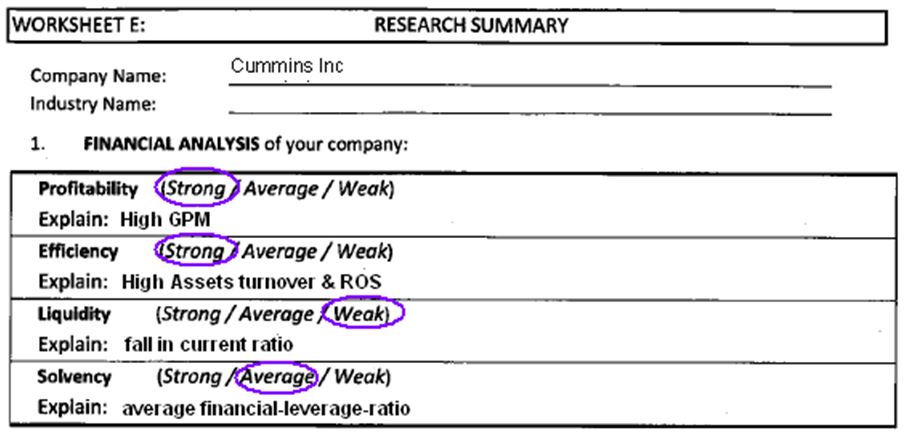
Research Summary
Profitability
The gross profit margin is the proportion of the turnover, which a business preserves following the direct expenses linked to generating the materials traded throughout a certain period; moreover, a rising profit margin means that the firm has a good pricing strategy (it is able to lift prices with small or no effect on sales) or that it possesses a rising productivity. It is notable that Cummins Company’s GPM rose from 20.08333 in 2009, to 23.9528202 in 2010, to 25.4266 in 2011, indicating strong overall profitability of the company in 2011.
Efficiency
Assets turnover of Cummins has risen successively from 1.225 to 1.5467; it is notable that asset turnover considers a business’s competence in utilizing its assets in creating an augmentation in the income – the superior the figure the better is the efficiency; consequently, this rising ratio is an indication of strong efficiency; moreover, increasing ROS means there is additional efficiency;
Liquidity
Although the current ratio increased in 2009, it fell again in 2011; as this kind of fall in the ratio demonstrates the deterioration of the liquidity position of the business, it is notable that the liquidity position of Cummins had fluctuated and then weakened over these three years. On the other hand, if there was a boost in the current ratio, it was quite natural that the liquidity position of the business had strengthened with time; however, as the liquidity position of Cummins is weak, it is likely to adversely affect the positive image of the company in front of the investors or banks.
Solvency
The financial-leverage-ratio is an appraisal of firm’s financial power projected by dividing its total liabilities by shareholders’ equity; it specifies what proportion of equity and debt the firm is using to finance its assets; a high ratio commonly denotes that a firm was antagonistic in financing growth with debt; so, this can result in volatile earnings because of additional interest-expense. In 2011, the financial leverage ratio of Cummins was lower than the past two years; so, presently, its position is average in terms of solvency.
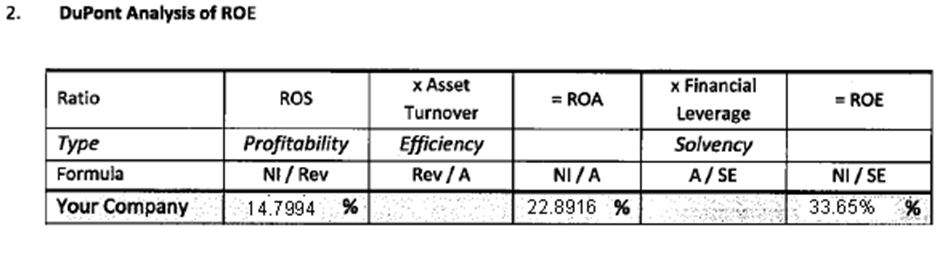
Dupont analysis of ROE
Table 1: Dupont analysis of ROE. Source: Self generated.
The table above shows that from 2009 to 2011, the Dupont of ROE of the company increased from 11.34% in 2009, to 33.65% in 2011; such a higher figure is a confirmation that the ROE of the company has increased.
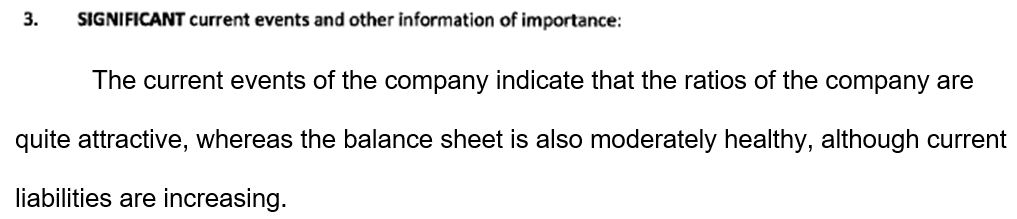
Summary of Current Events
The current events of the company indicate that the ratios of the company are quite attractive, whereas the balance sheet is also moderately healthy, although current liabilities are increasing.
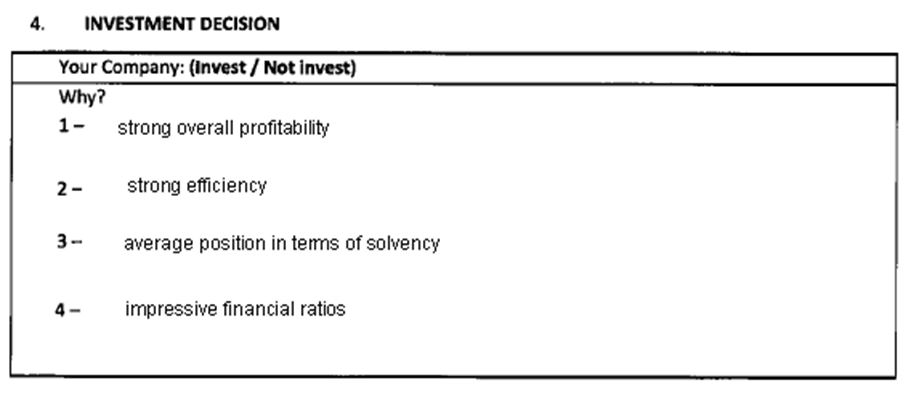
Investment in the company
It is feasible to invest in the company because the business has strong overall profitability, strong efficiency, and average position in terms of solvency due to impressive financial ratios.
References
Cummins: Form 10-K Annual Report. 2012. Web.
Jackson, Anna-Louise and Anthony Feld. “Machinery Stocks Gain as Global Slowdown Worries Abate.” Bloomberg Businessweek. 2012. Web.
Tita, Bob. Cummins Net Off 22% as Sales Decline. 2012. Web.
Yahoo Finance: Dividend payable by Cummins Inc. 2012. Web.
Worksheet A
Worksheet B
Worksheet C
Worksheet D
The additional data needed for ratio computations
Worksheet E