This working paper addresses the continued growth of Botswana’s economy and the key factors contributing to the growth. The economic performance of Botswana has been remarkably contrasted with that of other countries in the region making it worth investigating. According to Iimi, Botswana is richly endowed naturally thereby making it one of the richest countries worldwide in terms of diamond abundance (3).
The country’s economic growth has been attributed mainly to the mining industry, which has been contributing to a growth of 7.8% since the 1980s (Iimi 3). The presence of natural resources is not the only factor that guarantees the growth of an economy. The governance of the revenues from the resources is also a key factor to the progress of the economy. Economies with abundant natural resources have failed to experience economic growth while resource scarce economies have achieved economic growth resulting to “resource curse” phenomenon.
It is expected that countries with more natural resources should have higher economic growth rates from the exploitation of the available natural resources, which at times does not happen because countries endowed with great natural resources have failed to convert them into economic gains for themselves. This failure has been attributed to disagreements and conflicts between various stakeholders involved directly or indirectly during the exploitation of the resource. Taxation exerts the pressure of accountability on governments. However, in the case of natural resource-rich countries, revenue is mostly raised from the exploitation of the natural resources (Iimi 6).
Resource wealth can relieve the government from tax collection pressure, which forms fiscal discipline (Gupta et al. 167). The revenue from the sale of the natural resources may not necessary translate to economic growth due to the Dutch disease problem as sectors without a direct relationship with the natural resources tend to suffer from the appreciation of the national currency (Corden and Neary 830).
Botswana is highly dependent on its natural resources, which contribute to about 80 percent of the total exports from the country (Iimi 8). The country is the 18th largest resource exporter in the world placing it among the top countries that rely mostly on natural resources. This review indicates that even though the country gets a lot of income from natural resources, the labor absorbed by the mining sector is very low, and only accounts for 4 percent of the entire population. The trend analysis of the mining sector against the economic growth elucidates the key developments associated with the revenue from the natural resources.
Botswana has had good governance that has enabled it to experience economic growth from the revenue raised from the sale of diamonds among other minerals (Iimi 26). The continued political stability in the country over a long period has also contributed substantially to the development of the country. An empowered public that is vocal on government accountability is crucial in ensuring that there is transparency and good utilization of the resources available. The presence of an anticorruption authority with powers to report corruption cases to the president in Botswana has played a vital role in ensuring that state resources are not looted.
The office of the attorney general in the country is also independent of the government and politicians, which empowers the office to prosecute corrupt individuals. Most natural resource-rich countries have not developed because of resource unavailability but due to poor governance and utilization of the resources. A study contrasting the economic growth of 89 resource-rich and resource-poor countries has shown significant economic growth in the resource-poor countries compared to the resource-rich countries thereby indicating that the presence of natural resources in abundance in a country does not guarantee economic development.
The use of data across different countries with different characteristics such as income and continental locality diversifies the study. This study examines the relationship between natural resource wealth, growth and governance by applying empirical growth literature as reported by Barro (34). The use of the gross domestic product from the countries as the dependent variable makes it easy to conduct a trend analysis for the growth in the same countries. The endogenous variable used is a clear indication and reflection of economic performance. That the natural resources extracted are mostly exported abroad is an assumption made to ease the computation and valuation of the values of the minerals as data used is from the World Bank database.
A table of new variables for the growth of the real GDP (at constant prices), the growth of labor force and the ratio of external debt and real GDP:
A table of natural logarithms of the growth of the real GDP (at constant prices), the growth of labor force, the ratio of the investment share of real GDP, and the ratio of external debt and real GDP:
Descriptive Statistics for Individual Samples
Gross Domestic Product
The Ratio of Investment Share of Real GDP
Labor Force
Debt
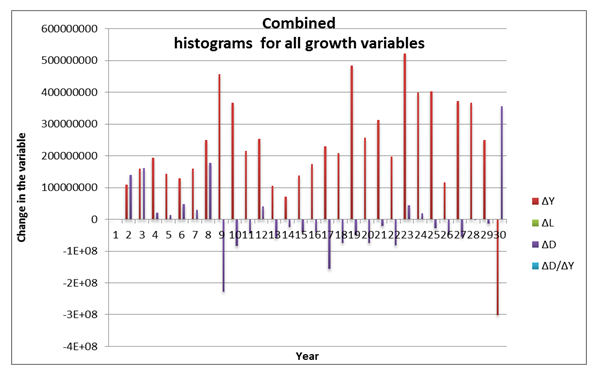
The histograms below indicate the growth of various variables. The years are depicted by numbers ranging from 1 to 30 indicating the period from 1980 to 2010. The representation of the years in this manner has been used in the entire work.
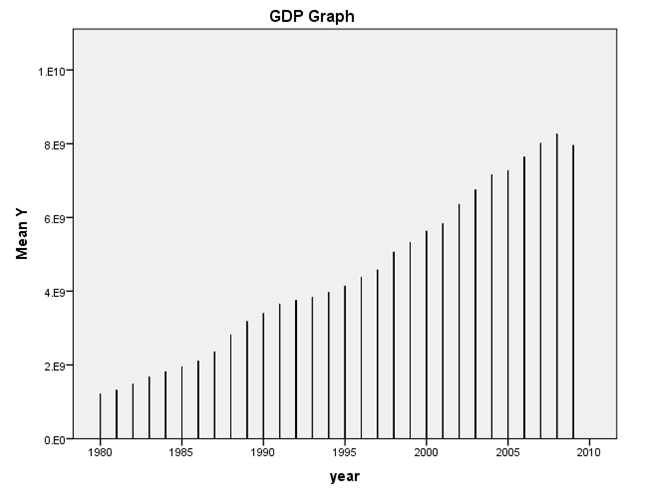
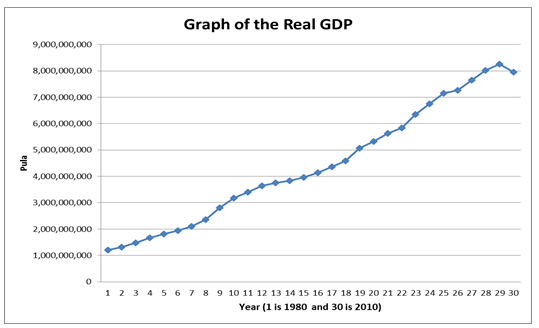
Growth of the Real GDP
The graph below indicates the increase in the level of the real gross domestic product over the years of utilization of the natural resources. The increase in the national income can be attributed to an increase in mining activities and availability of labor.
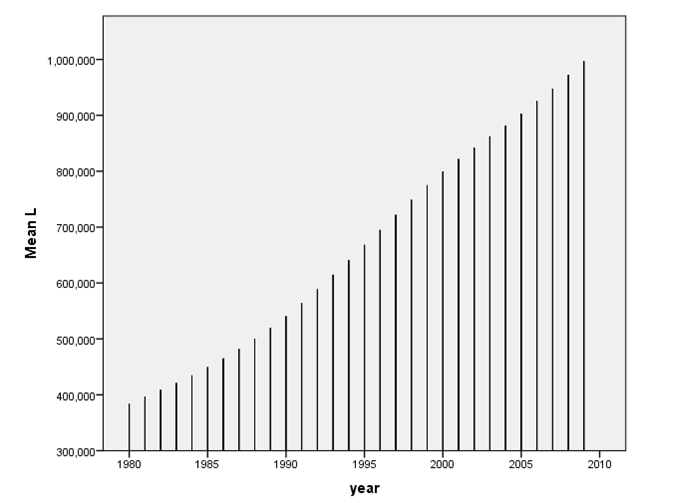
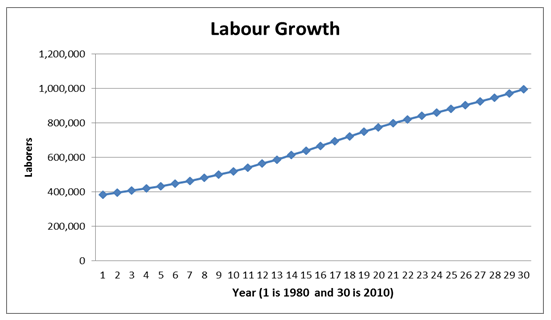
The Growth of Labor Force
There has been a constant growth in the labor force. The labor has increased substantially over the years. This increase can be attributed to a rise in the number of entrants into the labor market. The increase can also be attributed to the growth in population as well as the Asian crisis where Botswana citizens failed to secure jobs in Asian countries in the last years of analysis.
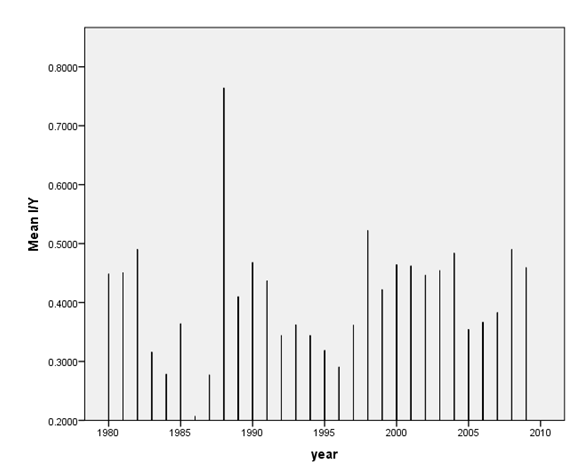
The Ratio of the Investment Share of Real GDP
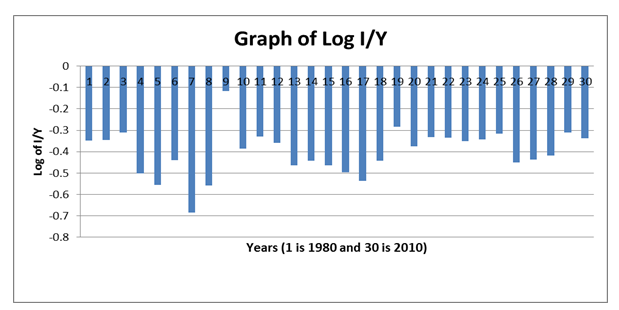
The investment ratio to GDP has been fluctuating with 1988 being the highest and 1984 recording the least value. This ratio indicates the proportion of revenue that is invested. Investment of revenues is crucial because Botswana is highly dependent on the mining industry. The country needs to broaden its economic horizons to avoid relying on mining only. To realize this objective, Botswana has to use the resources obtained from the mining industry to develop other sectors of its economy.
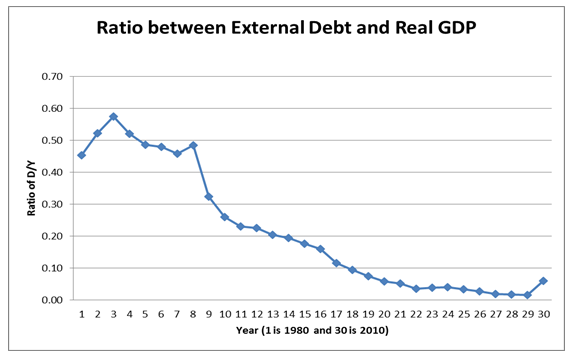
The graph indicates a decline in the ratio of debts to the real gross domestic product. This observation can be attributed to enhanced governance and management of the natural resources revenues. An increase in the ratio indicates that the country has numerous debts.
The figure below indicates a country whose GDP is higher than its debt, which is desirable to all countries.
Correlation matrix (from covariance analysis) of the variables: growth of the real GDP (at constant prices), the growth of labor force, the ratio of the investment share of real GDP and the ratio of external debt and real GDP
The table on correlation indicates that there is no connection between labor growth and the growth of debts. From the table, the correlation matrix is as shown below.
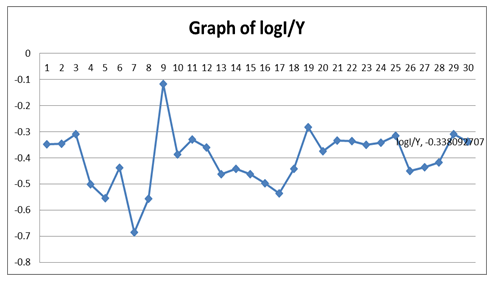
Histograms for natural-log versions of the variables: growth of the real GDP (at constant prices), the growth of labor force, the ratio of the investment share of real GDP and the ratio of external debt and real GDP
Growth of the real GDP (at constant prices)
Growth of Labor Force
Ratio of the investment share of real GDP
The ratio of external debt and real GDP
Correlation Matrix (from Covariance Analysis) of natural-log versions of the variables: growth of the real GDP (at constant prices), the growth of labor force, the ratio of the investment share of real GDP and the ratio of external debt and real GDP
The model chosen is a linear functional form of your model as it has a matrix with correlation.
Time series graph plots: growth of the real GDP (at constant prices), the growth of labor force, the ratio of the investment share of real GDP and the ratio of external debt and real GDP
Growth of the real GDP
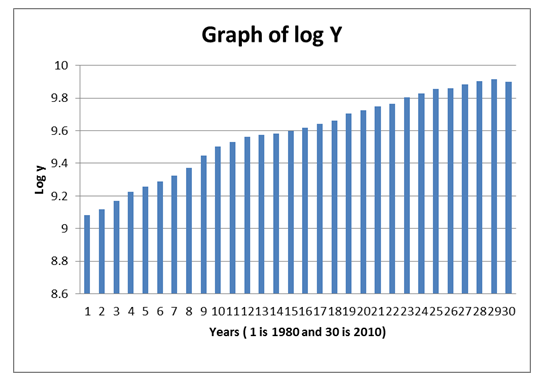
The table below shows how the real GDP for Botswana grew from 1980, which is the first year in the graph from 1,208,609,087 to 7,958,577,275 Pula in the 30th year (which is 2010). The trend of the GDP as depicted by the graph shows a constant increase. The increase can be attributed to an increase in mining activities.
Growth of the Labor Force
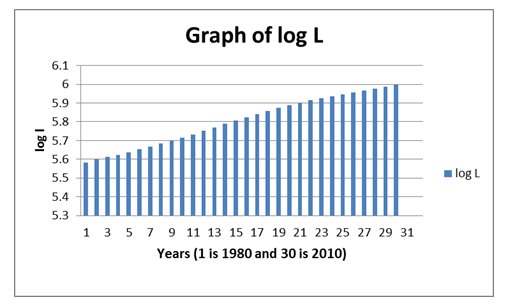
The amount of growth in the labor sector is high with the laborers reaching 996,375 in 2010 from 383,098 in 1980. The labor rise greatly contributes to an increase in the output of the mining sector. Despite the growth in the labor force, the mining industry suffers from the lack of skilled workers who can manage and work in technical jobs.
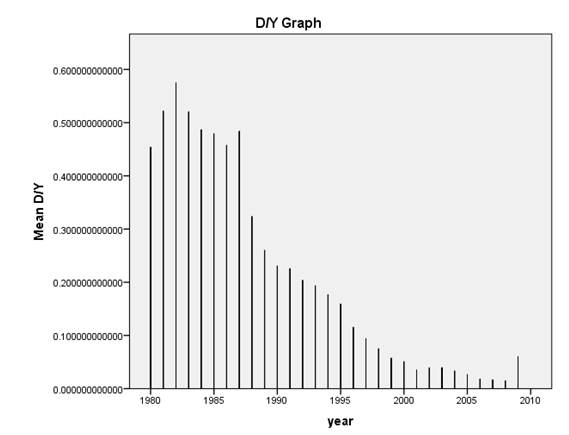
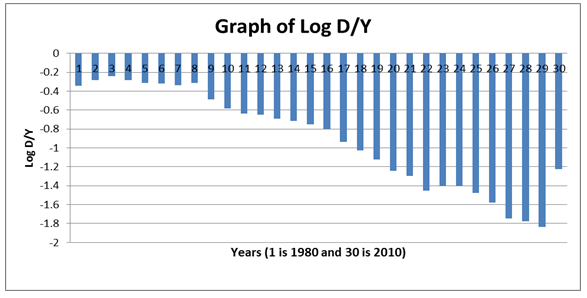
The Ratio of External Debt and Real GDP
The ratio of the external debt and the real GDP has been declining indicating that the country has been offsetting its external debt. The low debt ratio by 2010 can be attributed to good utilization of revenues by the government to finance its budget and the avoidance of external borrowing.
A scatter plot of the growth of the real GDP and the ratio of the investment share of real GDP
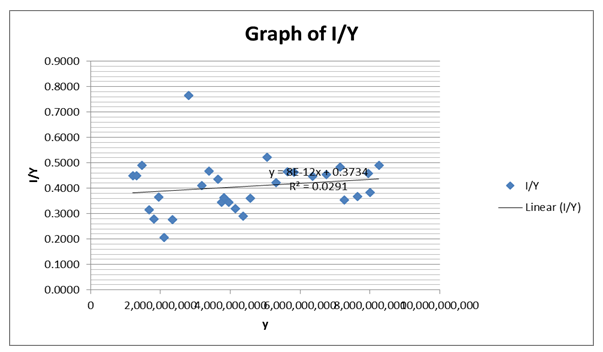
The value of R2 is 0.029, which is the variance of the dispersion of I/Y. This value is low and the best of fit line does not fall on any of the points thus indicating variation.
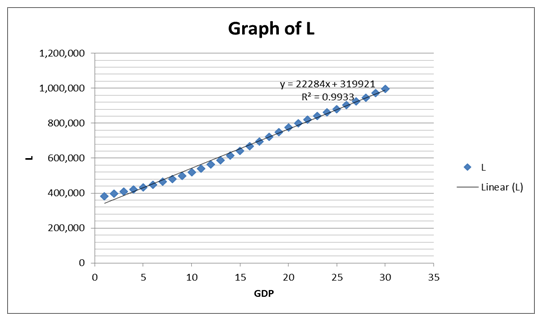
A scatter plot of the growth of the real GDP and the growth of labor force
The value of R2 is 0.993, which is the variance of the dispersion of L. The value is high, and the best of fit line nearly cuts on all of the points. This trend indicates that there is minimal variation from the mean.
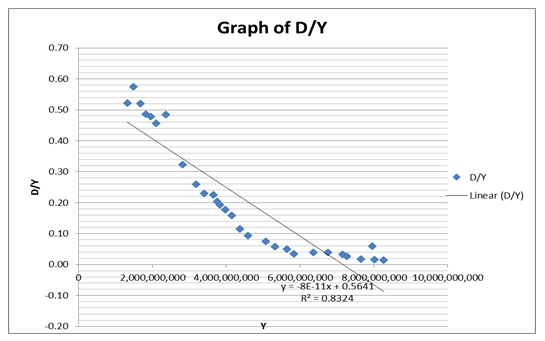
A scatter plot of the growth of the real GDP and the ratio of external debt and real GDP
The value of R2 is 0.832, which is the variance of the dispersion of D/Y. The value is fairly high and the best of fit line does not match any of the points thereby indicating the variation.
Regression of the growth of the real GDP (at constant prices) on the ratio of the investment share of real GDP, the growth of labor force and the ratio of external debt and real GDP
The R2 value depicts 0.672 of the variations are explained by the total variation. The coefficients of beta for L-0.014, D-0.652 and D/Y-0.381 affect the variations with these weights. The three variables vary uniquely with each having a different prediction (p) for L-0.08, D-4.138 and D/Y 2.170. The significance of the variables as indicated by the ANOVA table (p=0.002) shows that the model is significant. The variations of the variables as depicted by R2 compared with adjusted R2 have no large difference, which indicates that the variables are related and interdependent.
Residual graph for the growth of labor force
The graph depicts the high growth of labor in the country. The contraction of labor growth between 2001 and 2007 is due to the movement of labor out of the country to the Asian countries.
Residual graph for the ratio of the investment share of real GDP
The graph of the ratio of investment share of real GDP is negative, which depicts low investments and a bigger portion of the income has to be used in expenditures rather than in investments.
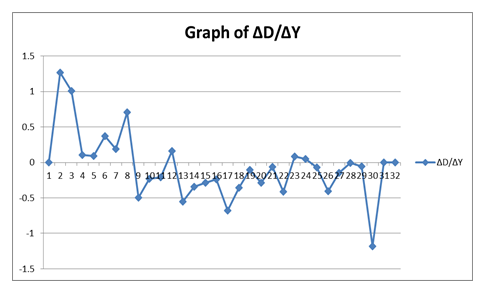
Residual graph for the ratio of external debt and real GDP
The residual graph for the ratio of external debt and real GDP indicates that there are negative values. The negative values are due to a decline in the level of income where the change in GDP is negative. However, the level of the ratio declines indicating a decline in the debt.
The test of significance at a 5% significance level of the independent variable on the dependent variable of the model is done in Step 15.
The variables have t values that are different. D/Y has a t value of 6.127 and has the least confidence interval indicating minimal dispersion.
Testing the overall significance at a 5% significance level of independent variables on the dependent of the model in Step 15
Heteroscedasticity
Heteroscedasticity does not exist as the correlation matrix depicts. The high dispersion of variables is not a cause of heteroscedasticity. The model is consistent and significant because the correlation matrix indicates the values of each variable from the matrix have constant variance.
Heteroscedasticity does not exist because it is below significant levels. The absence of heteroscedasticity indicates that the variance of the data is limited. Multicollinearity does not also exist as the model’s two-tailed test value of significance is zero. The variables are covered explicitly by the model. In addition, there is no autocorrelation indicating that the values are not correlated.
Works Cited
Atsushi Iimi 2006. “Did Botswana Escape from the Resource Curse?” IMF Working Paper African Department. Web.
Barro, Robert J 1997. “Determinants of Economic Growth: A Cross-Country Empirical Study”. NBER Working Paper No. 5698. Web.
Corden, Max W. and Peter J. Neary. “Booming Sector and De-Industrialisation in a Small Open Economy.” Economic Journal, 92.368(1982): 825-848. Print.
Gupta, Sanjeev, Benedicts Clements, Alexander Pivovarsky, and Erwin Tiongson 2003. “Foreign Aid and Revenue Response: Does the Composition of Aid Matter?” IMF Working Paper 03/176. Web.