Alternatives to a market economy
A market economy is regulated by the forces of demand and supply. The main characteristic of a market economy is that all resources are privately owned. Therefore, the decision on how to allocate the resources is made by the individuals without the intervention of the government. Further, there is freedom of choice to produce, sell, and purchase. The only constraints that the private owners face are capital availability and the prevailing prices in the market. Another feature of this market is that the force of competition keeps prices low. The competition also ensures that products and services are manufactured efficiently. Therefore, a market economy relies on an efficient market for trade to happen. A market economy does not exist in real life because most economies often work with government intervention. Further, properties are often held by both public and private owners. An alternative to the market economy is a mixed economy. This is a combination of private and public ownership of resources. In a mixed economy, there are some state-owned undertakings and economic planning. Another role of the government in such economies is giving guidelines for the allocation of resources that exists naturally (Jamison 2013).
The market for mobile phone handsets
An increase in consumer income leads to growth in disposable income. Therefore, the purchasing power of the consumer will grow because of the increased ability to purchase more commodities. The effect of an increase in income on demand will depend on the type of commodity. In this case, the mobile phone handset is treated as a normal good (Horner 2013). Therefore, an increase in consumer income will cause a rise in the quantity demanded as illustrated in the graph below.
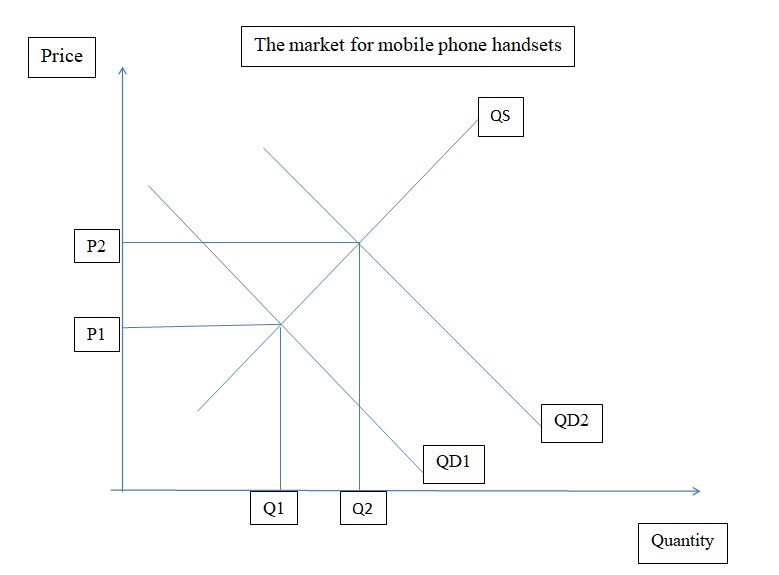
The original demand curve is QD1, while the supply curve is QS1. An increase in consumer income causes the market demand curve to shift outwards from QD1 to QD2. This will make the quantity demanded to rise from Q1 to Q2. This increase in the quantity demanded will cause upward pressure on prices. Therefore, the price will rise from P1 to P2.
Technical improvements that lead to a reduction of production costs will cause the supply curve to shift outwards. The outward shift of the supply curve implies that there is an increase in quantity supplied (Mankiw 2016). A graphical illustration of the changes is displayed below.
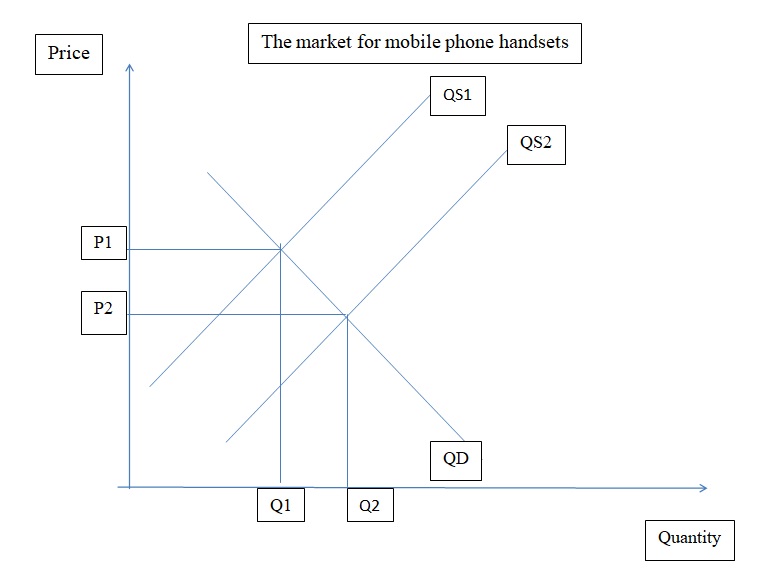
The original demand and supply curves are QD and QS1 respectively. Technological improvements affect the supply side of the market. Therefore, the supply curve will shift outwards from QS1 to QS2. This results in a rise in equilibrium quantity from Q1 to Q2. An increase in quantity causes the equilibrium price to drop from P1 to P2.
The fixed-line calls are complementary to phone handsets. This implies that they are consumed together. A drop in the fixed-line call charges will cause an increase in the quantity of demanded phone handsets. This will encourage consumers to buy the handsets (Tucker 2016). An increase in the demand for handsets is equivalent to an outward shift of the demand curve as illustrated below.
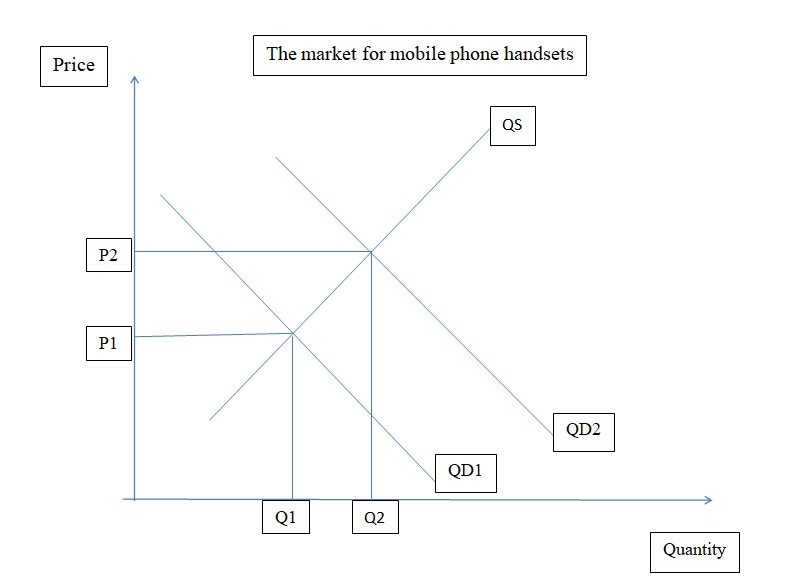
The original demand and supply curves are QD1 and QS respectively. A drop in fixed-line calls charges causes the demand curve to shift outwards from QD1 to QD2. At that price, the market is not in equilibrium. Demand exceeds supply. This will cause upward pressure on prices due to shortages. Therefore, the price will rise from P1 to P2.
Income elasticity
It measures the association between the change in quantity demanded a commodity and change in income. Income elasticity is arrived at through the division of a percentage change in demand by the proportionate change in income. The coefficient of income elasticity varies depending on the commodity. For instance, normal goods have positive elasticity. If the income elasticity is less than 1 but greater than zero, then the commodity is a necessity. This implies that as income increases, the demand for the commodity grows. For luxury goods, the income elasticity of demand is greater than 1 (Moon 2013). This implies an increase in income causes a more than proportionate rise in demand.
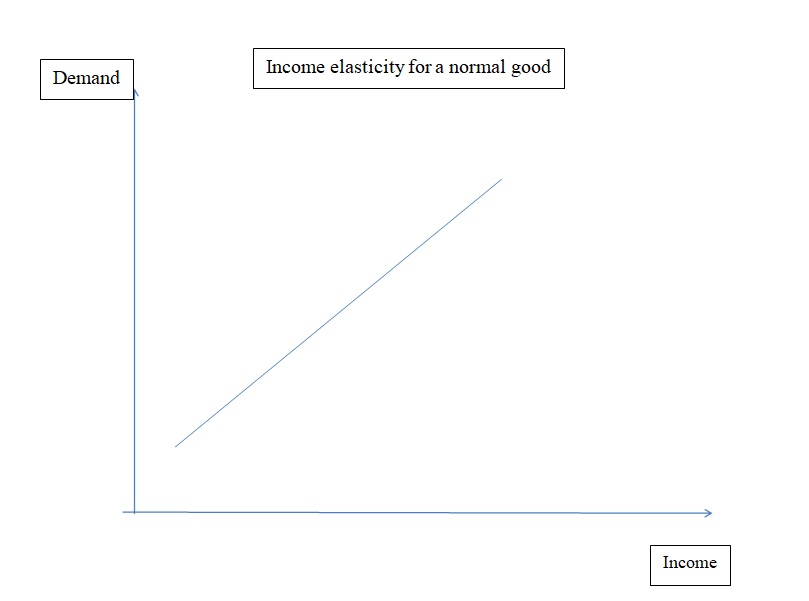
For a normal and luxury good, there is a positive association between income and demand as illustrated by the upward sloping curve. The coefficient of elasticity will determine whether it is a necessity or a luxury good. Finally, inferior goods have negative elasticity (Warren et al. 2013). This implies that an increase in income causes demand to fall as illustrated in the graph below.
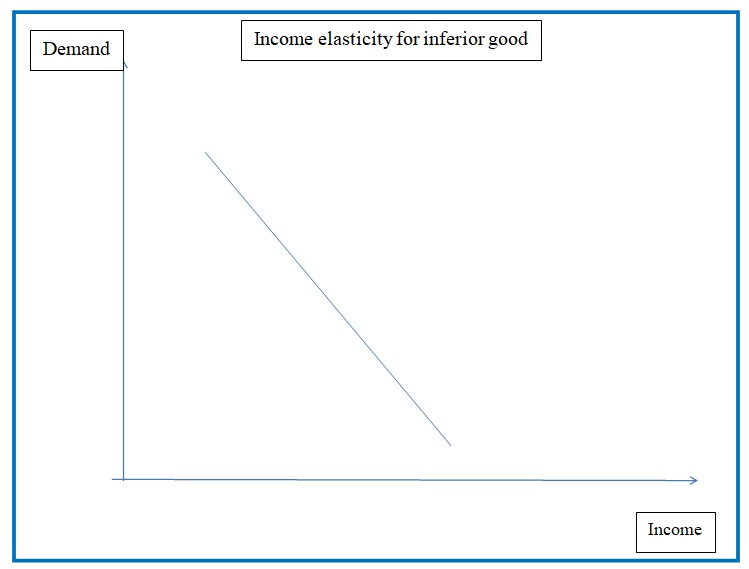
The relationship between income and demand for an inferior good is captured by the downward sloping curve. As income increases, the demand for the commodity declines.
Income elasticity of demand for food in rich countries
Studies show that the income elasticity of demand for food in rich countries tends to be lower than in emerging and poor countries. For instance, in the UK, the poorest 20% of the households spent 16.6% of their income on food, while the entire household spent 11.6% on food (Lipsey and Chrystal 2015, p.61). One factor that can explain this difference is that consumers in rich countries spend a small proportion of their income on food, which is a necessity. Thus, fluctuations in the income level will have a dismal effect on the purchase of food. This implies that the demand for food will be less sensitive to changes in income. Some of the other factors that contribute to the low elasticity for food in rich countries are high subsidies to farmers, reduced-Value Added Tax rates on food items, low cost of food production, and a large number of substitutes (Shapiro and Moles 2014).
Some of the goods and services that are likely to have high-income elasticity in rich countries are properties, foreign travel, entertainment, and education among others. These items have a high positive association with income. As income increases, then a consumer in a rich country will tend to increase consumption of these commodities.
Barriers to entry
In a perfectly competitive market, there are no barriers to entry and exit. However, the presence of barriers to entry eliminates the possibility of having a perfectly competitive market. These barriers to entry can either be initiated by market forces, legal, and technological factors. The first most important barrier is economies of scale. This occurs when a firm has a significantly lower average cost than other entities in the industry. Secondly, a natural monopoly occurs if the industry technology and demand conditions cannot permit more than one firm to operate. In such a scenario, there is no price at which two firms can operate and cover their costs. Another factor is the start-up cost. If the cost of venturing into the industry or starting the business is high, then it can prevent entry into the industry. There are also policy-created barriers. These are government actions that deter other firms from entering into a specific industry. For instance, patent rights granted to one company can prevent other firms from entering the market (Lipsey and Chrystal 2015).
Economies of scale
It basically denotes a scenario where an entity can reduce the average cost per unit by increasing the output. Therefore, it is a source of cost advantage to a company (Lipsey and Chrystal 2015). The economies of scale are mainly common in industries that use a huge amount of fixed cost in the manufacturing process and a low marginal cost of production. An example is in the production of steel. Also, companies with high research and development costs may have economies of scale. The economies of scale grant existing companies a competitive advantage in the industry. This is because they are enjoying producing commodities at a cheaper cost than their competitors. This increases their ability to charge lower prices than other firms in the same industry. Over time, companies that do not enjoy economies of scale may shut down due to the inability to recover costs. This leads to a reduction of competition in the market (Boyes and Melvin 2015).
Monopoly Market Structure
A pure monopoly market structure is characterized by a single firm operating in an industry. From a regulation point of view, a firm that controls at least 25% of the market share in a specific industry is considered a monopoly. A major characteristic of monopoly is that they sell unique products that do not have a close substitute. Further, there are barriers to entry into the market. This implies that there is a lack of competition in the market. A monopolist is a price maker of its product because the firm has market power. This can allow the company to sustain supernormal profit in the long-run. Finally, a monopoly firm can also exist due to economies of scale. A firm that enjoys economies of scale can also gain the status of a natural monopoly (Taylor and Mankiw 2017).
Strengths and Weaknesses of a Monopoly
There are a number of advantages of having a monopoly firm. First, the supernormal profits that are earned by monopolies can be invested in research and development. Secondly, monopolies can earn a country some export revenues. This occurs if a firm dominates the domestic market and infiltrates international markets. Another advantage of a monopoly market structure is that it leads to stable prices in the economy because they are determined by one firm and not the forces of demand and supply. A major drawback of this market structure is that a monopolist firm can exploit consumers by charging high prices for their products. The firm can also limit the output that it supplies in the market. Secondly, a monopolist can charge different prices for different buyers depending on the market conditions. This price discrimination can distort the operations of the market. Further, due to a lack of competition, a monopolist can provide substandard commodities in the market because consumers’ choices and sovereignty are reduced. Finally, a monopoly market structure leads to the loss of consumer surplus and economic welfare (Baldwin and Scott 2013).
Regulation of Monopolies
In recent years, there have been attempts by governments across the globe to regulate monopolies. This can be attributed to the drawbacks of a monopoly market structure and the abuse of monopoly market power. Some of the reasons why a government can regulate a monopoly are to prevent excess prices, to improve the quality of products and services that are offered by the monopolist, and to promote competition in the market. Therefore, the regulations seek to reduce the costs that are associated with operating a monopoly such as fewer employment opportunities, loss of competition, and inefficiencies (Goyal and Goyal 2013). The inefficiencies cover three areas. These are allocative, productive, and management efficiency. Under allocative inefficiency, a monopoly leads to deadweight loss as illustrated in the graph below.
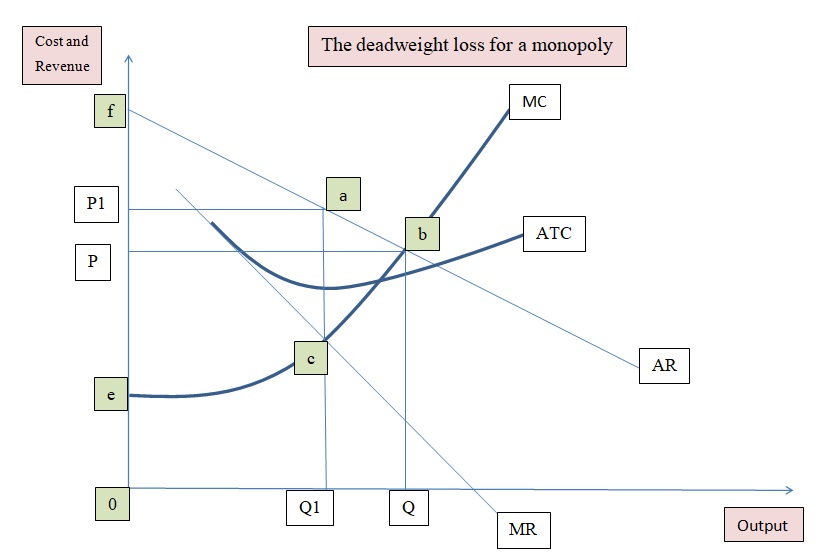
The graph above shows an example of allocative inefficiency that is caused by a monopoly firm. A perfectly competitive firm will charge a price at the P, while a monopolist firm will charge a price of P1. Therefore, a monopoly charges higher prices. Further, under perfect competition, the total economic welfare is represented by the area in the graph above. The consumer surplus under perfect competition is the area Pbf, while the producers’ surplus is the area CBP. However, under a monopoly, the total economic welfare is represented by the area access. The consumer surplus is reduced by the area PbP1a, while the producer surplus is reduced to ecaP1. Therefore, the loss of economic welfare is the area ABC. This area is lost due to the inefficiencies that are created by a monopoly and it is called deadweight loss. The loss of welfare has created the need for governments to regulate monopolies. Some of the approaches that are used by the government to regulate monopolies are price capping, regulation of the rate of return, prevention of merger and acquisitions, breaking up monopolies, nationalize the existing monopolies, forcing firms to unbundle their products, and use of yardstick competition among other ways. Further, most countries have implemented antitrust laws that ensure that the competitive environment is maintained (Bade and Parkin 2014).
Breaking up Monopolies
This represents a scenario where the government forces a monopoly firm to break up its business into several firms. This arises when an existing firm is becoming too powerful in the market (Kumar and Siddharthan 2013). An example of a company that was successfully broken up was Bell Systems in 1982. AT&T was a monopoly that was supported by the government. The company was efficient. However, it had the potential of practicing price-fixing. This created the need for the breaking up of the company. Besides, there was low competition in the long-distance telecommunication industry. The company was supposed to hand over the local calling services to smaller regional derivatives called baby bells. In addition to the long-distance business, the parent company was allowed to venture into the internet and computer industry. Thus, Bell System was separated into small companies that provided telephone services. The two new companies that were created after the break up were Regional Bell Operating Companies and AT&T. Before the breakup AT&T was the exclusive provider of telephone services within the US. In addition, the majority of the telephone equipment in the US was manufactured by its subsidiary Western Electric. Therefore, there was vertical integration that granted AT&T monopoly power. This led to a lack of competition in the provision of telephone equipment and supplies to operating companies.
After the break up there was an outpouring of competition in the telecommunication market. The derivative baby bells also performed well and they were more successful than the parent company. However, AT&T did not become successful because the computer business was unsuccessful. In addition, Western Electric was no longer profitable because they did not have the customer base that was guaranteed by Bell Systems. It had trouble finding its feet in the competitive market. The company tried to reinvent its self but was not successful. It was later absorbed by SBC communications, one of the baby bells. Despite the failure of AT&T to pick its self after the regulation, this example of break up is considered one of the most successful because the government achieved its objective of creating competition in the telecommunication industry. In addition, there was a decline in long-distance rates and better service delivery due to competition. In recent history, there have been attempts to break up the operations of Microsoft Corporation because the company is perceived to be abusing the monopoly power that it is currently enjoying. However, these attempts have been unsuccessful (Whitehead 2014).
Reference List
Bade, R. and Parkin, M. (2014) Essential foundations of economics, 7th ed., New York: Pearson Education.
Baldwin, W. and Scott, J. (2013) Market structure and technological change, 3rd ed., London: Taylor & Francis.
Boyes, W. and Melvin, M. (2015) Microeconomics, 10th ed., Boston: Cengage Learning.
Goyal, V. and Goyal, R. (2013) Financial accounting, 3rd ed., New Delhi: PHI Learning Private Limited.
Horner, D. (2013) Accounting for non-accountants, 9th ed., Philadelphia: Kogan Page Limited.
Jamison, M. (2013) Industry structure and pricing: the new rivalry in infrastructure, 2nd ed., Berlin: Springer Science & Business Media.
Kumar, N. and Siddharthan, N. (2013) Technology, market structure and internationalization: issues and policies in developing countries, 2nd ed., New York: Routledge.
Lipsey, R. and Chrystal, A. (2015) Economics, 14th ed., London: Oxford University Press.
Mankiw, N. (2016) Principles of macroeconomics, 8th ed., Boston: Cengage Learning.
Moon, M. (2013) Demand and supply integration: the key to world-class demand forecasting, 4th ed., New York: Pearson Education Inc.
Shapiro, A. and Moles, P. (2014) International financial management, 10th ed., New Jersey: John Wiley & Sons, Limited.
Taylor, M. and Mankiw, N. (2017) Economics, 5th ed., Boston: Cengage Learning.
Tucker, I. (2016) Economics for today, 9th ed., Boston: Cengage Learning.
Warren, C., Reeve, J. and Duchac, J. (2013) Financial and managerial accounting, 14th ed., Boston: Cengage Learning.
Whitehead, J. (2014) Microeconomics: a global text, 2nd ed., New York: Routledge.

