The firm’s management is responsible for adding value or maximizing value of the shareholders, thus they must make sure that the firm makes higher earnings by increasing the value per share that is Earnings per Share. The firm should also pay dividends to owners, and make sure that they increase the value of the share by making profit. This paper will consider the HBI’s dividend policy, share prices and returns, its risks and growth over the years as well as determine the intrinsic value of the firm.
Dividend policy
Hanesbrands Inc. (HBI) has never paid and will never pay dividends on the outstanding stock as it has no plans to pay or declare dividends. The firm had an intention in 2006 to adopt a policy of dividend payment, dependent on legally available finances which were to be a modest cash dividend paid after every quarter on the outstanding common stock. If the firm decide to declare dividends in the future, the dividends amount will depend on the real future earnings, regulatory restrictions, debt covenants, capital requirements, and any other contractual restrictions as well as judgement of firm’s Board of Directors (Wikinvest.com: Hanes Brands Inc)
The firm’s direct competitors include Maidenform Brands, Inc (MFB) and Limited Brands, Inc. (LTD), of which only LTD pays dividends. Limited Brands, Inc. (LTD) increases its dividends after every year by $0.05; thus, it adopts a dividend policy with constant dividend growth. HBI also has some indirect competitors such as Page Industries Ltd (PAGEIND.BO), SuperGroup Plc (SGP.L) and Pantaloon Retail (India) Ltd (PANTALOON.NS), all of which pays dividends except SuperGroup Plc (Finance.yahoo.com).
Stock prices and returns
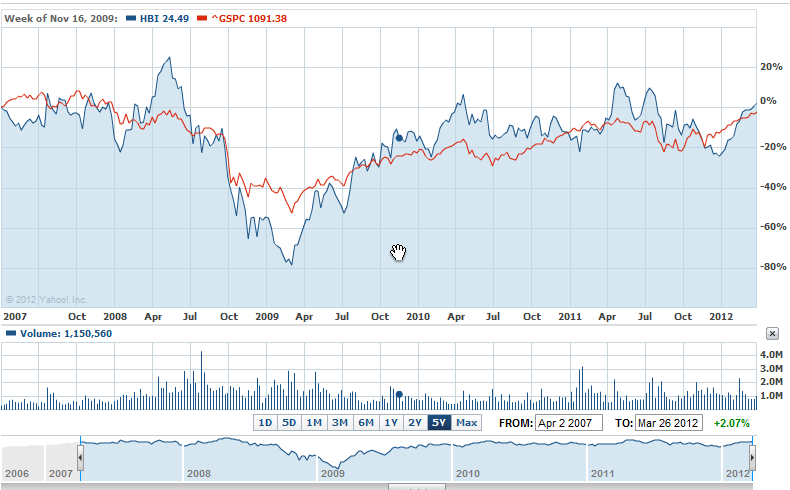
Chart 1 indicates HBI’s stock and S&P 500 (market) prices for the last five years. The chart shows that HBI’s stock price moves in the same direction as the market (S&P 500), which is to say as the market price increases the firm’s stock price increases as well and vice versa. This is well explained by the positive covariance between the market and firm’s stock prices of 0.00568.
In addition, the relationship between the two is very strong and positive as shown by correlation coefficient of 0.69.
Beta coefficient
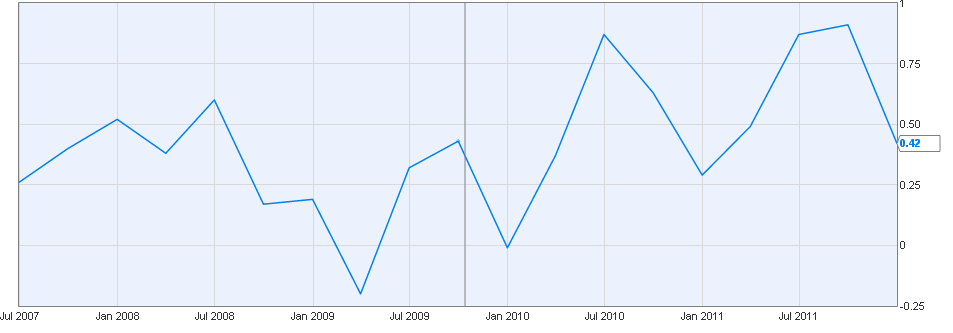
The risk of an asset is measured by Beta coefficient (β) according to CAPM (Fxwords.com). Beta allows the analyst to evaluate the nature and extent of that relationship with reference to the market. For instance, beta coefficient of 1.5 can be interpreted to mean that the firm’s stock is more risky than the market, it means that if the market’s return move by 1% relative to the mean, the return of the firm’s stock will move by 1.5% relative to the mean (Fxwords.com: Russell.com). The HBI’s beta coefficient can be determined as follows;
β = Covariance HBI, S&P 500 / σ2s&p 500.
β = 0.00568/0.05772= 1.71
Therefore, the HBI’s stock is more risky than the market in that, as the market’s returns move by 1% relative to the mean, HBI’s returns move by 1.71% relative to the mean.
The value line estimates the HBI’s beta to be 1.2 while other financial services like Reuters, Google, Ycharts and Yahoo Finance estimate the beta coefficient to be 1.82, 1.83, 1.812 and 1.85 respectively (Reuters.com: Google.com: Ycharts.com: Finance.yahoo.com; Valueline.com). In general therefore, all the financial services estimate that the firm is more risky than the market, which is as have been predicted by the model predicted.
Growth
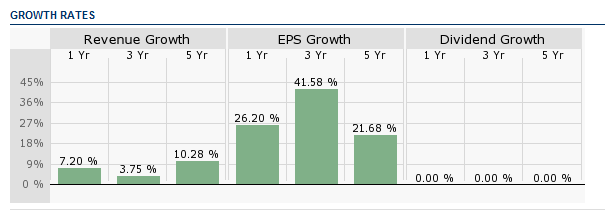
Chart 2 shows the firm’s 1-year, 2-years and 5-years growth rate for revenue, EPS and dividends, where the dividends have a zero growth because the firm does not pay dividends.
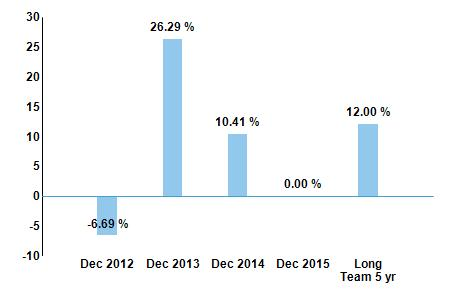
HBI anticipates the net sales for the 2012’s first quarter to be around $1,000 million and the loss for every share to be $0.35. While for the year 2012, the firm anticipates sales to rise by 4% or 2% based on the 2011 financial year and the EPS to vary from $2.50 to around $2.60, counting in the loss of about $0.30 in image wear. In the first quarter of the year 2012, the company’s analysts expect the firm to earn revenue of $1,080 million and an EPS of $0.34. While for the full year they expect it to make $5,000 million and $3.0 as revenue and EPS respectively (Reuters.com). In five years time, analysts expect it to have yearly growth rate in earnings of 12%. In 2012, they expect -0.33% growth compared with 2011’s earnings, while in 2013 they expect the firm’s earnings to increase by 2.51% based on 2012’s forecasted earnings.
Over the last five years, the firm earned the highest EPS on September 2011and the least on December 2008 while the five-year average growth was 21.68%. The firm has never paid dividend thus there is no dividend growth. Lastly, the firm’s stock price has increased by 11.09% over the last five years.
Valuation
Enterprise value = market capitalization + net debt
Market capitalization = $2440m
Net debt = Total Liabilities – Net receivables – Cash and Cash Equivalents)
= 2,880m + (3353.608m + 933.719m – 625.380m – 35.345m) = $6,506.602m
= $6,506.602m/ 97.710m = $66.59 per share
The firm’s value of both equity and debt is $66.59 per share. This means that the firm’s share is supposed to sell at this value in the market instead of $29.54 per share, which was the share price on March 1, 2012. This implies that the share is undervalued by the market, but this value is a theoretical price at which the company can be acquired at. Enterprise value is the most accurate firm’s value representation because the acquirer will have to pay the firm’s debt when taking over HBI. Therefore, it offers a more accurate valuation value for takeover because it takes in debt in value calculation.
Price/earnings multiple (P/E) = price (on 30th March, 2012)/ earnings
Trailing-twelve-months = $29.54/ $2.69 = x10.98
Assume forecasted EPS of (2.5 + 2.6)/2 = 2.55
Forward-looking = $29.54/ $2.55 = x11.58
The market is willing to part with $10.98 for HBI’s current earnings and it will be willing to part with $11.58 next year for 2012 firm’s earnings. It also means that the HBI’s investors will take 11.58 years to recover back their initial investments in firm’s shares based on 2011’s earnings. The industry’s trailing-twelve-months P/E is x13.43, this means that HBI has low P/E, implying that the stock is undervalued.
Price-Earnings-Growth (PEG) ratio = P/E / Earnings growth
Forward-looking = 11.58/ -6.69% = -173.10%
Based on PEG the stock is undervalued as the ratio is less than 100%.
In conclusion, current stock price is $29.54 compared to intrinsic value of $66.59 and based on PEG and P/E the HBI’s stock is undervalued which makes it a good purchase right now.
Works Cited
Finance.yahoo.com: Industry: Textile-Apparel Clothing 2012. Web.
Fxwords.com: Beta coefficient 2007. Web.
Google.com: Finance: Hanesbrands Inc 2012. Web.
Hanesbrands Inc: Investors 2010. Web.
NASDAQ: HBI: Stock research – analysts forecasts earnings growth 2012. Web.
Russell.com: Beta. 2009. Web.
Reuters.com: Hanesbrands Inc (HBI.N) 2012. Web.
Thestreet.com: Hanesbrands Inc (HBI: Growth rates) 2012. Web.
Valueline.com: Hanesbrands Inc (HBI) 2012. Web.
Wikinvest.com: HBI: dividend policy: 2009. Web.
Ycharts.com: Hanesbrands (HBI) 2012 Web.