Company Profile
Apple Inc. was incorporated by Steve Wozniak and Steve Jobs in 1977. The company was incorporated with a total net worth of US$250,000. The company has successfully grown to become the modern day Apple Inc. employing over 60,000 people globally and a sales volume of $65 billion as at 2011. Apple was ranked 35th among the Fortune 500 companies in 2011 having climbed 21 slots from its 56th position in 2010. The company has been consistent in the production of innovative technology products that have revolutionized every aspect of human life. In 2000, the company produced the iPod, in 2007 it came up with the iPhone, in 2010 the iPad and the latest iPad 2. The iPad has demonstrated to the world the inherent power in tablet computing.
Financial Analysis
The financial performance and strength of Apple Inc.over the three years namely 2007, 2008 and 2009 will be analyzed using the following ratios:
Table1: Liquidity Ratios
In 2007, the company had a significantly higher current ratio. However, following the 2007/ 2008 recession, the ratio dropped. The same trend is evident in the companys quick ratio with a high of 2.32 in 2007 and a low of 1.86 in 2009. The collection period in days increased from 25 days in 2007 to 34 days in 2009. The main reason for the increase is because the financial crisis reduced individuals disposable income. People had no money to spend consequently the company had to be more lenient to its debtors by giving them a longer grace period to repay their debts. It is possible because of the lenient credit policy that the company has managed to reduce the number of day’s sales in ending inventory from 9 in 2008 to only 7 in 2009. As a whole, Apple is still liquid implying that the company is in a position to meet its current obligations using its current assets.
Table 2: Profitability Ratios.
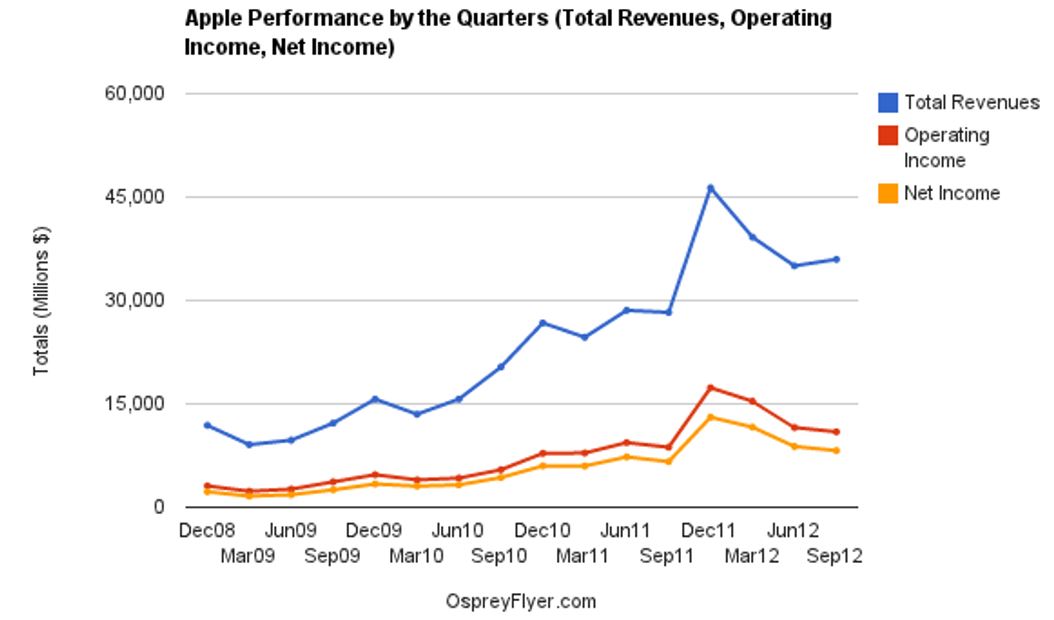
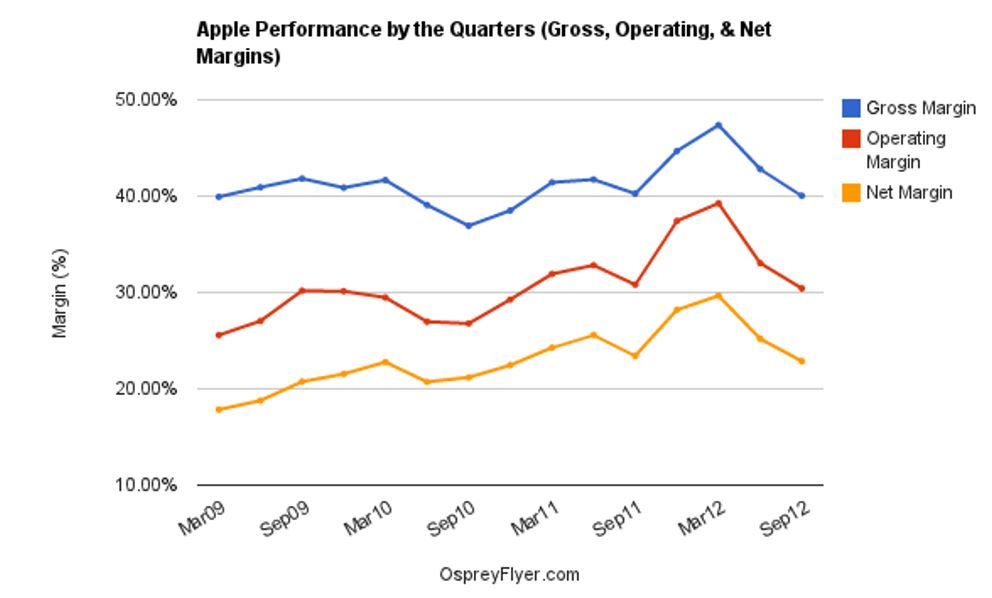
Gross profit as a percentage of sales for Apple has been increasing consistently from 33.97% in 2007 to 34.31% in 2008 and finally to 35.96% in 2009. The same upward trend is evident in the companys operating income. Return on equity and return on assets have been declining over the same period. On the other hand, cash return on assets has been wavering. From 2007 to 2008, the ratio increases by 0.02 and from 2008 to 2009, the ratio declines by 0.05. The high profitability margins may be attributed to high sales revenues despite the difficult economic times (Don 55).
On the other hand, the decline in return on equity, cash return on assets and return on assets is because of the company’s policy of retaining its earnings and investing more of its funds in long-term market securities. In summary, Apple has registered strong profitability and expects an upward growth in its profits in the near future.
Table 3: Analysis of capital structure (Solvency).
Apple’s financial leverage-Debt/ EBITDA- is zero over the three-year period. The zero leverage is because the company uses only retained earnings and shareholders equity to finance its operations. The company has sufficient liquidity to the extent that it has not incurred any debts. This is beneficial to the company because it does not pay any interest expenses (Yahoo Finance 1).
Table 4: Market Test Ratio.
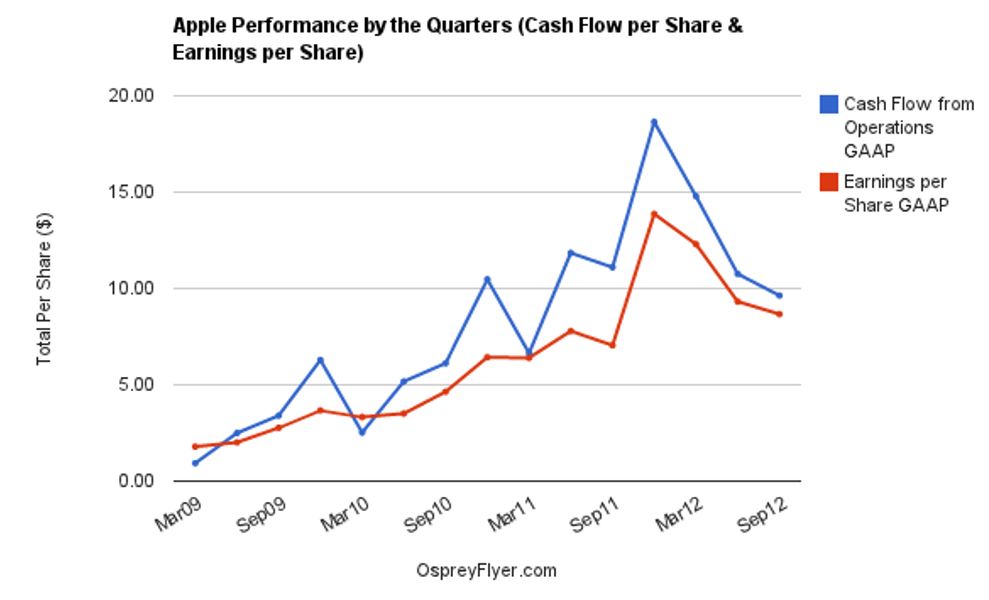
Both the diluted and basic earnings per share for Apple have registered an upward trend in the three-year period. The increase is attributed to increased profitability for Apple over the same period. The companys market to book value declined from 9.12 in 2007 to 5.37 in 2008. However, in the 2009 fiscal year, the ratio increased to 5.85. Similarly, the price to earnings ratio declined from 37.99 in 2007 to only 23.4 in 2008. However, in 2009, the ratio registered a slight increase to 28.54. This increase was a direct result of the increase in the market price of the company’s shares.
Table 5: Apple Inc. latest ratios.
From the latest ratios indicated in table 5, Apple appears to be a company with a strong financial position at present and the company is expected to maintain its growth path in the years ahead. Earnings per share indicate that stockholders of Apple have benefited significantly from 2009. In 2007 and 2008, the company’s earnings per share performed poorly because of the global financial crisis. However, from 2009, the ratio picked up and it has been registering year-to-year growth. In 2012 for example, Apple’s earnings per share stood at 44.15.
The company’s profitability margin has also recorded a considerable increase from 2007 through 2012. In 2007, the company’s profitability margin stood at 14.56%. However, in 2012, the margin has almost doubled to reach 26.67%. Return on equity has equally recorded an upward increase from 2008. From 2007 to 2008, the ratio declined by 1.07 due to the adverse effects of the financial crisis. However, from 2009 through 2012, the ratio has recorded a substantial increase. From 2008 through 2012, Apple registered an increase of 12.31 in its return on equity. The company has recorded a high return on its assets. This implies that the management is adequately utilizing the company’s assets to generate more sales. Return on assets grew from 12.22% in 2008 to 23.7% in 2012.
The company’s debts to equity ratio and interest coverage have remained zero over the five-year period. This indicates that the company only uses equity in its capital structure with no debt. This explains why it has no interest expenses. Apple is one of the richest companies in the world and it has sufficient capital to fund and run its operations (Capron and Glazer 13). The company’s book value has increased significantly from 2007 to 2012. In 2007, the companys book value stood at $16.71. However in 2012, the company’s book value has grown to $126.1., this represents a 655% increase.
The company’s price to sales ratio has equally been wavering over the five year period, although at a moderate rate. The ratio attained its highest in 2008 at 4.43 and a record low of 1.13 in 2007. This was due to the global economic downturn witnessed in the same period. In 2011following the death of Apple founder and CEO Steve Jobs, the price to sales ratio dropped from 3.22 in 2010 to 2.93 in 2011. However, in the 2012 fiscal year, it appears that the companys price to sales ratio has embarked on its growth path with investors paying up to 3.43 times for every dollar worth of Apples sales.
Conclusion
Our audit firm should accept Apple Inc. Company as an audit client. This is because Apple has registered a strong financial performance in the past five years and it is projected that the company will maintain its impressive performance. The company has equally recorded an upward growth in its earnings. In addition, the companys shares currently trades over its book value. All these indicators point to a strong company that is worth taking as a client.
References
AAPL. Financial Ratios for Apple Inc. AAOL. 2012. Web.
Appledigest. Apple Digest: Apple Financial Performance. Appledigest. 2012. Web.
Capron, Noel and Glazer, Rashi. Marketing and technology: A strategic co alignment. Journal of Marketing 5. 3 (2011):10-21.
Don, Fred. Apple makes leap to video. The Atlanta Journal Constitution 2 (2011): 45-67.
Yahoo Finance. AAPL: summary for Apple Inc. Yahoo Finance. 2012. Web.