Background
Johnson & Johnson (JNJ) operates globally in health care sector and its main task involves R&D, production, as well as sales of produced products (Johnson & Johnson, 2012). To achieve its goals the firm has divided its business activities into three divisions: Medical Devices and Diagnostics, Pharmaceutical, and the Consumer (Johnson & Johnson, 2012). Medical Devices and Diagnostics division principally provides circulatory ailment management products, products which act as sports medicine, for women’s health as well as for professional diagnostic. The Consumer division offers products that are meant for oral care, skin care, women’s health, baby care and wound care. In addition, the firm produces other products for nutritional purposes, prevention and wellness platforms and pharmaceutical products sold over-the-counter. The pharmaceutical division provides various products in therapeutic field such as anti-infective, contraceptive, immunology and neurology among others. The firm was established in 1886 and its head office is in the New Brunswick, New Jersey (Finance.yahoo.com, 2012).
Additionally, Johnson & Johnson has raised dividends distributions for about 48 years consecutively. Berkshire Hathaway owned by Warren Buffett is the largest investor in the firm and firm’s dividend stock delivered to the owners 4.10% as annualized return over the last decade. The firm is increasing its operations into long-range opportunities like the vaccines business. The company’s growth in the developing nations as well as cost restructuring opportunities assist the firm in making additional profits over time (Dividendgrowthinvestor.com, 2011).
Through its operations the firm unites and inspires its people. With its 118,000 workers, Johnson & Johnson has been able to make $65,000 million as sales revenue in the year 2011, a 5.6% increase compared to 2010. The firm was able to increase its operational sales by 2.8% but domestic sales in United States declined by 1.8%; but due an increase of 12.4% in the global sales the firm was able to reflect an increase of 7% in its operational activities (Johnson & Johnson, 2012).
Thus, this paper will evaluate the firm’s stock reaction to any type of information available in the market. The paper will also seek to find out the possible current value of Johnson & Johnson and as a conclusion give the investor a recommendation as to whether the firm is a good investment.
Delivering value
Earnings are used by many investors to measure the firm’s financial strength in their quest to unearth great investments. An investor may use earnings to find out a good investment opportunity but one should put in mind that earnings do not depict everything as they can be incomplete as well as misleading. Therefore, in order for an investor to comprehend the ability of the firm to make money as well as reward any investments put in, it’s frequently better to concentrate on the cash flow indicator. This can be done by breaking down the firm’s Statement of Cash Flow to make out the total amount of money the firm normally make, and most importantly identify how the cash generated is used by the management.
The net income is used to analyze the cash flows (Motley Fool Staff, 2012). The net income of Johnson & Johnson has been remarkable for the past five years. All the non-cash expenses such as adjustments to the net income, depreciation, changes in stock, accounts receivables, and liabilities are added back to the net income in order to obtain operating activities cash flow as shown on Table 1. Then capital expenditures amount is deducted resulting to the Free Cash Flow (FCF) which is the outstanding amount left to the shareholders after carrying out all business activities (Motley Fool Staff, 2012). For the last twelve months the firm was able to pull in $11,947 million as amount left for the shareholders while in 2010, 2009, 2008 and 2007 the firm was able to return $14,001 million, $14,206 million, $11,906 million and $11,939 million to the shareholders respectively.
Table 1: Cash Flow
NB: *ttm – Trailing Twelve Months
Therefore, in order for the firm to reward the owners it must use the FCF through share repurchases and dividends. And cash not distributed to the owners can be invested in other firms, deposited in a bank or used to amortize the loan. In the last five years the firm has distributed dividends to the shareholders as shown on Table 2.
Table 2: Total Shareholders Return
The firm has been paying dividends for decades. In 2008 the firm increased its dividend per share by 10.80% to $1.795 per share compared with 2007. While in 2009, 2010 and 2011 the company dividends increased by 7.52%, 9.33% and 6.64% respectively. In general, for the past five year period the dividend has increased by 38.89%.This means that the firm dividend policy is progressive in nature where it has to increase dividends every financial year. Currently the firm has dividend yield of 3.5%, which represent the highest yield the firm has ever had for many years.
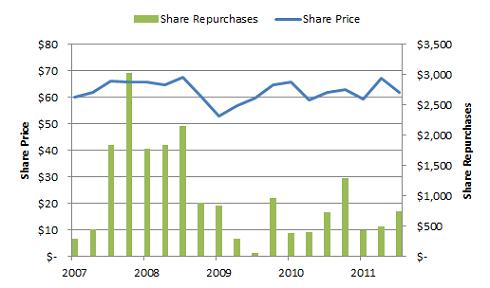
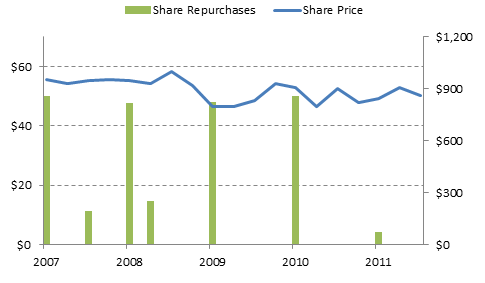
Other than paying dividends to the shareholders, the firm carries out share repurchases in order to boost its Earnings per Share (EPS), currently at $3.49 (trailing twelve months) as well as increase the growth of dividends (MATT, 2011: Finance.yahoo.com, 2012). In the year 2011, 2010, 2009, 2008 and 2007 the firm repurchased $3.00 billion, $2.80 billion, $2.10 billion, $6.70 billion and $5.60 billion worth of shares respectively as shown by Table 2. For the past five years, JNJ has bought back a reasonable number of its stock leading to a fall in its outstanding shares as shown by Chart 1.
Most of the firms have a tendency of being reasonably poor at buying back their shares, they mostly repurchase shares when they are most expensive and pull back when the shares are inexpensive (Motley Fool Staff, 2012). Let us now determine whether JNJ falls in this category.
In 2009, just like other firms, JNJ’s repurchases dried up when the firm’s share was dirt inexpensive. This move may have raised many questions as to whether it was a sensible move to accumulate cash when the economy was on verge of going over the cliff, or if it was an overlooked opportunity. For the past few years the stock of JNJ has looked fairly valued and I suppose the management has generally carried out a reasonable job with its share repurchase as represented on Chart 2.
Finally, the Total Shareholders Return (TSR) is determined by adding share repurchases and dividends as shown by Table 2. For instance, consider Chart 3, Table 3 and Chart 4 which show how dividends have contributed to the TSR.
TSR = [Dividend paid + (Closing share price – opening share price)]/ opening share price
Table 3: TSR
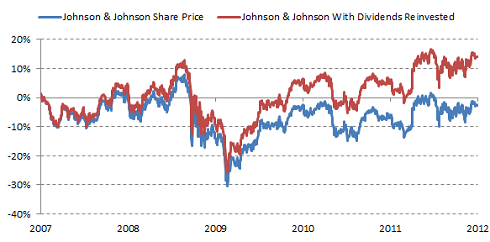
In 2011, 2010, 2009, 2008 and 2007 the firm returned 7.98%, -1.11%, 9.38%, -6.50% and 2.89% to its shareholders respectively. Without dividends the shareholders return would reduce by the same proportion of dividend as shown by Chart 4 below, which is not an inexcusable enhancement to achieve an otherwise poor share performance.
Revenue and income
In the past decades, JNJ has experienced steady growth. The recent financial crisis, 2008 to 2009, halted the growth leading to a plagued performance in the year 2010 as presented in Chart 5 below.
JNJ revenue increased by 6.44% and income decreased by 8.55% over the past five years.
Statement of Financial Position
JNJ has a stable financial position. The company’s operations are varied, and its statement of financial position is outstanding. The firm has a current ratio of more than two, and it has a debt/equity ratio of about 0.16. In addition its goodwill is not more than 33.33% of shareholders’ equity and the firm is more than able to pay its cost of finance as it can cover interest 30 times, which makes it to be among the few non-financial firms to have a credit rating of AAA (MATT, 2011).
Investment
JNJ has a well-built pharmaceutical pipeline that has possibly one of the most successful drugs in the market. In 2010, the Medical Devices division was comparatively strong and its good performance partly counterbalanced the poor performance in the Consumer division. The firm’s growth can be attributed to it R&D, partnering with other firms as well as through acquisitions. The latest large acquisition was that of Crucell, which cost more than $2,000 million as offer price for Dutch vaccine firm. Besides its growth, the firm provides share repurchases and dividends to raise the TSR at a higher rate compared with the firm’s growth (MATT, 2011).
The firm has also invested in the developing markets as well as in the BRIC nations (Brazil, Russia, India and China). In the developing market the firm has been able to make a double-digit growth that counterbalances poor performance in the industrialized nations, and in the long-term, most developed nations have aging populace which will need health care (MATT, 2011).
Thus, in order for the firm to offer significant returns to shareholders, a firm with similar size to JNJ, need to have organic growth and acquire other firms in addition to returning cash back to owners in form of dividends as well as through fairly-priced repurchases (MATT, 2011).
To measure how the firm has done in the past or presently, the investor should concentrate more on cash. The amount earned by the firm is not so much vital as to how much money is really flowing in, and the amount flowing in is not as vital as what the firm’s management really does with the money. Therefore, the shareholders should put in mind that they own JNJ and should consider how the managers are managing the firm’s cash.
Market Value
Market Value of Equity
The Market Value Added (MVA) is a past performance measure that gauges the value the firm adds to the owners. Unlike book value, the market value uses the value of share as generated by the market for instance the share price of the stock in the stock market (Luesby, 2012).
MVA can be calculated as follows:
- MVA = Market Value of Equity – Book Value of Equity
Where: Market Value of Equity = shares issued x share price, and book value is the value of the equity as per the balance sheet.
Table 4: Market value of equity
In the year 2008, 2009 and 2010, the MVA increased by -12.52%, 4.31% and -9.30% respectively. All the MVAs are positive this means that the market value of equity is higher than book value of equity. In the year ended December 31, 2011 the firm’s market value of equity was higher than the 2010, 2009 and 2008. As shown on Table 4, the book value of equity was lower than $60,000 million this means that in 2011 the book value of equity was approximately $60,000 million. Therefore, in 2011 the MVA was still positive. The high MVA indicates that JNJ will be able to add more value to the owners in the future based on the stock market evaluation.
Share price
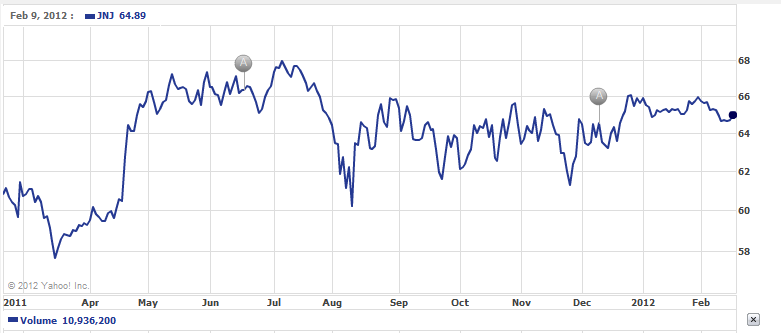
JNJ has a market capitalization of $177.57 billion. Over the last one year the stock attained a low and a high price of $57.50 and $68.05 respectively. On January 31, 2012 the stock closed the day at $65.91while on February 17, 2012 it closed the day at $64.99.
On February 18, 2011 the stock was selling at $61.11 and reduced by 2.46% to $59.64 on February 25 on the day of dividend payment of $0.54 per share.
The price increased by 3.02% on February 28 and then dropped to the lowest price of $57.50 on March 16. Following that drop the price increased by 16.85% to $67.19 on May 12. This may be as a result of major developments during this period for instance, recalling of the Surgical Drain Products, reorganization of the consumer division in wake of the recalls, possibility of the firm to purchase Synthes for $20,000 million, due to the 2011financial year EPS guidance which was raised, acquisition of Synthes Inc on April 26 and the firm’s HIV drug among others.
The insider transactions such as share acquisitions and option exercise did not have much effect on the share price. In general, the market was bullish during that particular period.
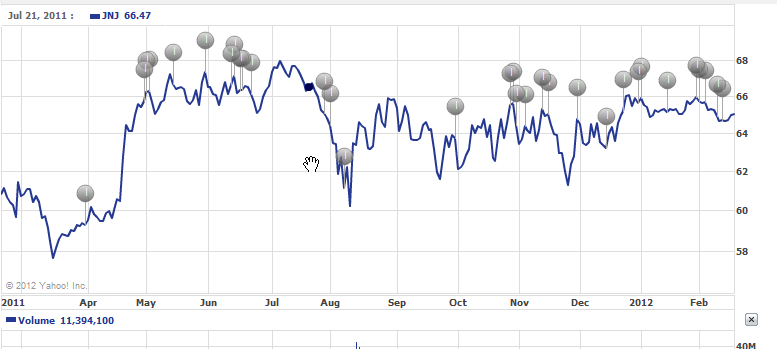
The prices remained on the higher side and attained the highest price on July 6 of $68.05. During this period the analyst opinion instigated by the Morgan Keegan changed leading to a slight decrease by 2.23% in price from $66.51 to $65.06. The price then increased to the highest price for the year. Before dividends payment on May 26, the price dropped and increased later to $67.29. The price may have remained on the higher side as a result of several insider transactions such as acquisition of shares, disposition, and sale. Also the major developments like approval of new drugs, another approval from the US for Hip Replacement System, the firm’s Anaemia drugs and blood thinner may have contributed to the prices of shares remaining high.
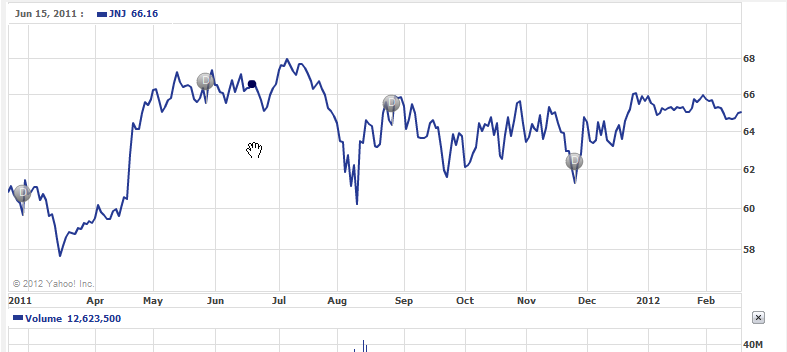
The stock price took a downward trend after attaining its highest price and dropped to a low price of $60.20 on August 10, and then increased later by 7.29% to $64.59. Following that, the price did not fluctuate by a big margin, implying that the speculative investors did not earn much return as capital gains. But from November 11 to November 25 the price decreased by 6.1% to $61.27, and increased later to $64.72 on November 30. Later on there was no much fluctuation in price from December 2011 to February 2012. The dividend payment had the same effect as before, meaning that before the dividend payment the price dropped and after the payment the price increased as shown on Chart 6. All the insider transactions and change in analyst opinions led to reduction in price while before any dividend payments the price of the stock decreased and increased after the payment.
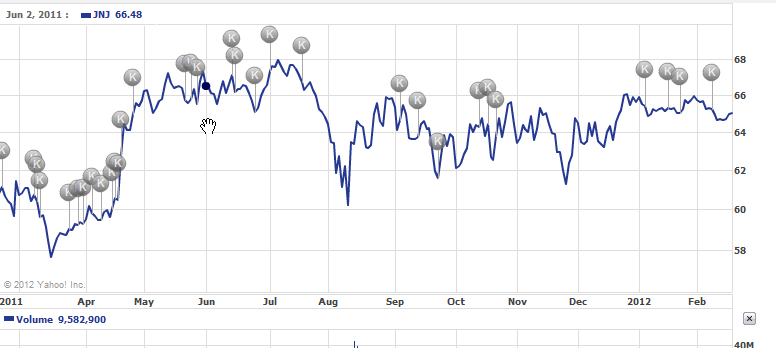
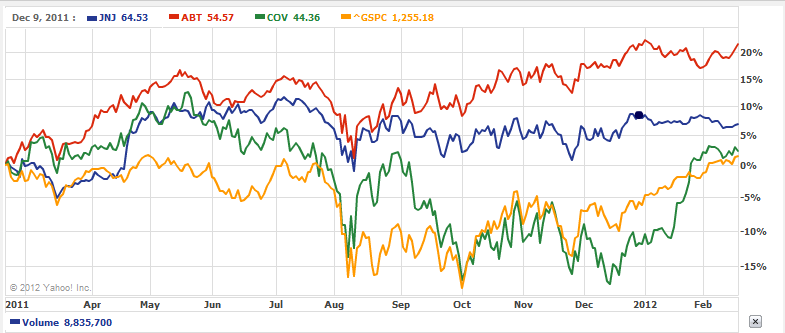
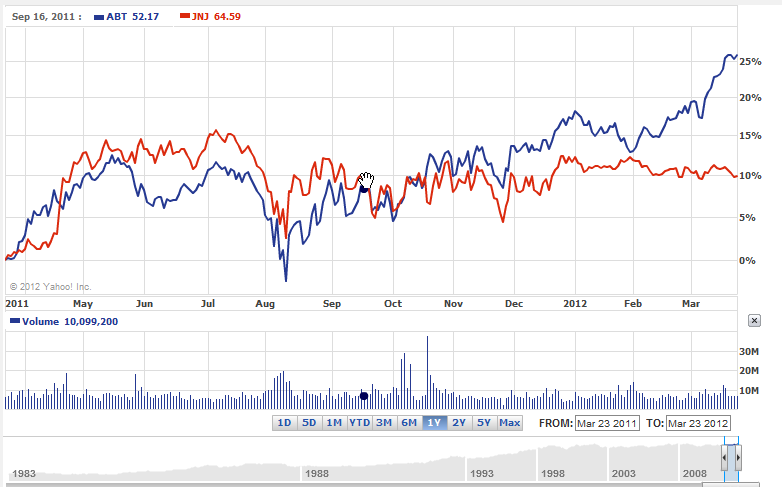
In addition, key developments led to the same price trend like that witnessed in dividends, in that before any development or announcement the share price took a downward trend while after the development the price took an upward trend. Compared with its competitors, Abbott Laboratories (ABT) and Covidien Plc (COV), the JNJ’s stock performed lower than ABT and higher than COV. While when compared to the market, S&P 500 (GSPC), JNJ performed well than the market. This implies that the JNJ’s stock has a higher price than the market or COV, but has a lower price compared to ABT. Also as it can be seen from Chart 10, the JNJ’s stock is moving with the market meaning that it has a strong positive correlation with the market. Using its beta of 0.56 we can say that the JNJ’s stock is less risky than the market. This means that if the market moves by 1% relative to the mean, then the return of JNJ will vary by 0.56% relative to the mean.
Valuation
Valuation is carried out to determine the worth of any item by comparing liabilities with assets. Valuation is important because it enables the investors to determine whether they will go on with the investment, it is also important in financial reporting, capital budgeting and merger & acquisitions among others (Secondventure.com, 2011: Business-valuation.net, 2012). In this case, we will value JNJ to determine its current worth through the use of three techniques; Net Asset Value (NAV), Price/Earnings (P/E) Ratio and Discounting Cash Flow (DCF).
Net Asset Value
NAV describes firm’s total assets, less total liabilities. That is, it is the equity or book value of business. NAV can be used to represent the total value of equity. One can determine the value of each share by dividing NAV with outstanding shares to obtain NAV per share, which is value of assets belonging to every share. It is helpful for shares valuation in an industry where the firm’s value emanates from assets that the firm holds instead of generated profit (Sec.gov, 2007: Pietersz, 2011).
NAV = Total Assets – Total Liabilities
Table 5: NAV
NAV per share = NAV/ outstanding shares
= $57,080/ 2,740 = $20.83 per share
The firm’s NAV is less than the market capitalization of $177.57 billion by $120.49 billion; this implies that any investor would be ready to buy the firm at a higher price than NAV as shown on Table 5. The difference between the market value and NAV arises because elements like assets and liabilities used to determine the NAV are historical in nature. Also the market value is determined by the market forces and it is the current value of the firm’s asset in the market, thus making the two values to differ. With that huge margin between the NAV and market capitalization, one can deduce that the firm has a high value and its profitability is high making it a good target for investment since it will be able to improve shareholders value through extra cash flow from operations.
Price/Earnings Ratio
P/E considers the firm’s earnings and share price relationship (Little, 2012). It is the most well-known stock analysis metric but it is not the only valuation method that can be considered. It is calculated as follows;
P/E = Share price/ EPS
Where share price is the price on January 31, 2012 and EPS is the forward looking EPS or trailing EPS. Using Trailing EPS for the last twelve months of $3.49 the firm trailing P/E ratio will be as follow;
P/E = $65.91/ $3.49 = x18.86
Based on Shadunsky (2012), an analyst, the EPS for the year 2012 will be $5.44 which is an increase of 8.8% compared with year 2011. The dividend is expected to grow by 2.2% this year, 2012 by CNBC (2011). Therefore, in order to determine forward P/E ratio one need to determine share price after one year. According to CNBC the forward P/E will be 12.7 with a growth of 2.2% in EPS from $5 to $5.11. Thus, the firm’s EPS will be between $5 and $6; in this case the firm’s EPS can be the average between the analyst forecasted EPS and CNBC which is $5.28 [($5.44 + $5.11)/2 = $5.28]. Thus, forward share price will be approximately $67.06 ($5.28 x 12.7= $67.06).
Forward P/E multiple = $67.06/ $5.28 = x12.70
It can be noted that when EPS increases P/E ratio decreases. On January 31, 2012 the market was willing to part with $18.86 for the JNJ’s earnings. While on February 17, 2012 the market was willing to part with $18.62 ($18.62 = $64.99/ $3.49) for the firm’s earnings. Based on the predicted EPS of $5.28 the investors will be willing to part with $12.70 for the firm’s earnings next year. Also it can be interpreted to mean that the investors will take 18.86 or 18.62 years for them to recover their earnings based on firm’s 2011 earnings, and 12.70 years based on 2012 earnings. When the firm has a high P/E it means that the market will be willing to part with more for its earnings. Many investors consider a firm with high P/E to have an overvalued stock, which may be true but it is an indication that the market expects the stock to perform better in the future and that is why the market has priced the stock high. Alternatively, low P/E indicates that the market has “a vote of no confidence” or that stock has been overlooked by the market (Little, 2012: Luesby, 2012). Compared with its competitors, COV and ABT, JNJ has a high P/E while compared to the market and industry the firm has a high P/E as shown on Table 6.
The right P/E depends on the investor’s readiness to invest in firm’s earnings. The investor’s willingness to invest in the firm implies that he/she believe the firm has good long-range potential besides its present position. Another investor might think that what you consider “right” P/E is wrong (Little, 2012).
Discounted Cash Flow
DCF is used to determine the firm’s value using Time Value of Money (Schmidt, 2012). In this method the projected cash flows are discounted using discounting rate to determine present value. In firm’s valuation, Free Cash Flow (FCF) is used which is obtained after deducting capital expenditure from operating cash flows (Bplans.com, 2012: Schmidt, 2012).
In 2012, the firm expects to make earnings ranging from $5.05 to $5.15 per each share while the operational growth is expected to be about 3.5% to 5.5%. Assume that the firm will make 5.15 per every share this year, sales will increase by 11.87% p.a. and the operational growth will be 4% p.a., consequently the effective rate of tax will be 21.5% p.a. Also assume that the firm will use $500 million this year as capital expenditure and $519.4 million p.a. there after based on past five years average (Ycharts.com, 2012). Therefore, the firm’s projected income statement will be as shown on Excel. Therefore, discounted cash flow for the next 10 years and the value of the firm will be determined as follows and as shown in excel;
Value of Equity = Free Cash Flow/ Discount rate
Discount rate = TSR/ shareholders equity
Assume TSR and shareholders’ equity for the year 2012 will be $9,193 million and $65,250 million
= $9,193/$65,250
=14.09%
Value of equity = $188,162.40 million
Value per share = $188,162.40 / 2,740 shares = $68.67 per share
Dividend (Gordon) growth model
In fundamental analysis, Gordon model can be used to determine the business or stock’s value. The model is utilized as investment strategy according to dividend yield. The model values the firm using presently paid dividends and the dividend growth pattern which the firm has shown for a long time. Some of the investors are uncomfortable with such a strategy but it is a vital model that dividend investors need to understand (Tyler, 2011).
The model indicates the past performance, and thus it does not promise how the firm will perform sometimes in the future. But only the information available can be used to decide which investment to take. Therefore, in investment making decision, the Gordon model is a useful tool in construction of investment portfolio which seeks to offer an increasing income stream. “However, it is not the be all and end all of due diligence that should be performed on a firm” (Tyler, 2011).The stock value is determined as follows;
P = D1 /(k – g)
Where;
- P = current stock price
- D1 = Dividend to be paid
- k = cost of equity
- g = dividend growth
- P = 0.57 x (1 + 10.20%)/ (14.09% – 10.20%)
= $16.15 per share
This implies that the stock is overpriced when compared to its current price of about $64.49. It also mean that the firm share should be $16.15 for investors to earn 14.09% based on this model.
Reconciliation
The three techniques have diverse values and no technique is more superior to the other. Since they all have their own advantages and delimitations, for instance, NAV uses the book values which are historical in nature, P/E ratio uses earnings which are accounting figures that are vulnerable to many types of manipulation, thus making P/E measure similar to earnings used to determine it.
P/E is a figure that is used by many investors with immense weight as if the measure tells the entire story. Evidently, it does not because if it does the investors would not require other measures. On the other hand, DCF uses FCF and most people consider it to be a very strong tool since it focuses on the cash to be generated by the firm in the future (Pietersz, 2011: Schmidt, 2012: Little, 2012). In order to obtain a more realistic measure we may need to reconcile the three; this can be done by determining the average or the weighted average (Yee, 2004). Since DCF considers the firm’s capability of making earnings in the future we may need to allocate more weight to it. Assume NAV, P/E ratio and Gordon Model are allocated 20% each and DCF is allocated 40%, thus the firm’s value estimate is determined as follows;
Firm’s value = (NAV x 20%) + (P/E x 20%) + (DCF x 40%) + (Gordon model x 20%)
= ($20.83 x 20%) + ($12.7 x 20%) + ($68.67 x 40%) + ($16.15 x 20%)
= $37.40 per share
Total value of the firm = $37.40 x 2,740 = $102,486.96 million
Abbott Laboratories (ABT)
Delivering value
ABT generated income of $4,550.6 million and cash of $8,377.1 million over the last 12 months. This implies that the firm turned 21.8% of the income into FCF, which sounds pretty remarkable as shown on Chart 11 below.
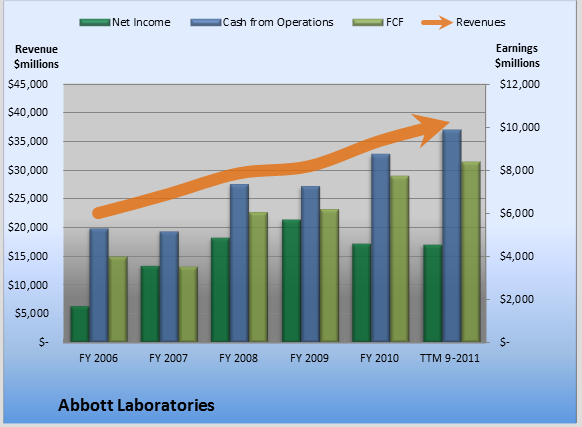
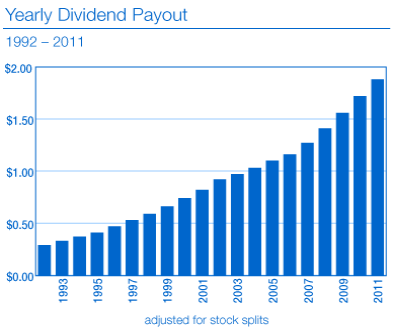
ABT has used the FCF shown above to pay dividends or buy back shares to or from the shareholders. ABT’s shareholders earn returns from their investment in the firm through dividends, share repurchases and capital gains. The firm has increased its dividends over the last five years by 45% from $2.0 billion in 2007 to $2.9 billion in 2011.
In 2010 shareholders received more returns in total compared to other years because the firm purchased back more shares than 2011 and paid relatively higher dividends than 2009, 2008 and 2007.
Over the past five years the minimum amount of shares ABT purchased back was $82.49 million worth of shares, and maximum amount was $673.20 million and on average ABT purchased shares worth $342.43 million (Motley Fool Staff, 2012: Ycharts.com, 2012).
ABT has a tendency of buying a huge amount of its stocks within the first three months of each year but that trend ended in 2011. Shares seem to be reasonably valued in latest years, thus the share buybacks was not wasteful but when combined with share issuance shown above, share buybacks have created no considerable value to shareholders. In the last five years, ABT shares earned 22% that falls to 5% with exclusion of dividends, which is not a good boost to otherwise weak stock performance (Motley Fool Staff, 2012).
JNJ generated more income than ABT throughout the five years as shown by Chart 15. In addition FCF generated by JNJ was more than ABT; this explains why JNJ generated more returns to its shareholders in terms of share repurchases and dividends as shown on chart 16 below. Therefore, JNJ performed better than ABT in terms of cash flow and many long-term investors will be willing to invest in JNJ than ABT while speculators will be willing to invest in ABT due to high fluctuations in its share price as we shall see later in the next sections. In total JNJ generated more returns to the shareholders. It also issued more shares to the investors than ABT as shown below.
Both shares for JNJ and ABT seem to be reasonably valued over the last five years as shown by Chart 2 and Chart 14, respectively. Unlike ABT, JNJ share repurchases has added significant value to the shareholders’ return over the last five years. Therefore, JNJ share buybacks increased shareholders’ returns significantly but for the ABT it increased returns by a small proportion.
Market Value of equity
ABT’s stock currently trade at $60.40 per share. At this level of price, the ABT’s stock has a dividend yield of 3.40%. The firm paid $11.95 as dividends in almost 10 periods in the past 10 financial years. The shareholders of ABT have sustained negative change of 1.1% in the share price in the past period. The firm’s stock trades at P/E multiple of 20.07, price-to-book multiple of 3.5 and price-to-sales ratio of 2.2, which are trailing multiples for the last twelve months. Over the last 10 years shareholders earned 22.7% as average return per annum on equity (Dividend Dog, 2012).
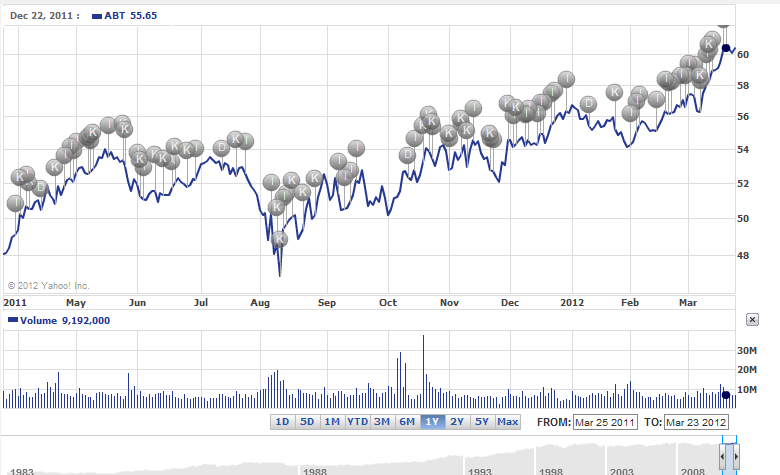
The changes in share price is as a result of insider trading (I) for instance, on March 1, this year, Michael Warmuth carried out seven transactions, and during this time the ABT’s stock ranged from a low of $56.72 to a high of $56.77. For the last 12 months Michael has disposed 46,130 shares in total and earned $2,528,363 as proceeds and purchased no shares from ABT. He has also carried out other transactions like awards or grants, tax liabilities payment and Options’ exercise. In total the insider trading over the last 12 months totalled $108,844,854 as sales and no purchase took place. Other activities that may have led to the changes in share price include key developments (K), dividend payments (D) and analyst opinion (A) as shown by Chart 17 below (CNN Money, 2012).
JNJ’s stock on the other hand, traded recently at $64.55 per share, with a dividend yield of 3.50% and has paid $13.73 as dividends for 10 periods in the last 10 financial years. In the last one year the shareholders sustained a negative change in share price of 0.5%. For the last twelve months the JNJ’s stock traded at P/E multiple, Price-to-book ratio and price-to-sales ratio of 15.9, 2.9 and 2.8 respectively. The shareholders earned an annual average return of 27.8% on equity (Dividend Dog, 2012).
Comparing JNJ and competitor ABT, we can conclude that JNJ delivered more value to its shareholders than ABT as a result of high dividends payment, dividend yield and annual average return. But the market is willing to part with more money for ABT’s 2011 earnings due to its high trailing P/E than for JNJ’s 2011 earnings. Chart 18 indicates that ABT’s stock in the past three months changed by huge margin. This means that a speculator who bought and sold shares during this period earned high capital gains compared to one who invested in JNJ.
Valuation using P/E ratio
According to CNBC (2012) ABT’s EPS will grow by 7.7% for the next one year, in the year ended December 2011 the ABT’s EPS was $3.03 per share this means that the forward looking EPS will be $3.26.
- Forward EPS = $3.03 x 1.077 = $3.26
- P/E = Share price/ EPS
- Trailing P/E ratio = $54.15/$3.01 = x17.99
- Forward P/E ratio = $54.15/$3.26 = x16.61
On January 31, 2012 the investors were willing to part with $17.99 for the firm’s 2011 earnings and based on forward looking P/E the investors will be willing to part with $16.61 for the ABT’s 2012 earnings. Also it can mean that the investors will take 17.99 and 16.61 years for them to recover their earnings based on 2011 and 2012’s earnings.
Using forward P/E, ABT will have a higher P/E of x16.61 than JNJ which will have a P/E of x12.70. This means that the market will be willing to part with less for JNJ’s 2012 earnings and more for ABT’s 2012 earnings because the market expects ABT to perform better than JNJ in the future.
Conclusion
In general, I suppose JNJ’s stock is a firm choice for growth and dividend yield right now. The firm is stable, exceptionally diverse with fair potentials for growth and a huge global exposure as well as with more than average performance in terms of dividend yields. Currently, the firm’s share price has a low variation meaning that the capital gains are very low. The firm is focused on creating shareholders value and investors are rewarded through share repurchases and dividends. JNJ has a high value, this means that the management was able to add value to the shareholders and that the investors are willing to purchase the firm’s stock putting in mind that they expect the firm to earn more in the future and that is why the market has put a high bid on it. Therefore, JNJ is a stock to buy for growth investors and to sell for value investors.
References
Abbott: Dividends history 2012, Web.
Bplans.com: Discounted Cash Flow 2012, Web.
Business-valuation.net: Valuation methods 2012, Web.
CNBC: Abbott Laboratories 2012, Web.
CNBC. 2012. Johnson & Johnson, Web.
CNN Money: $1m of ABT sold by Michael Warmuth 2012, Web.
Dividend Dog: Growing dividend from 12 healthcare stocks 2012, Web.
Dividendgrowthinvestor.com: Johnson & Johnson (JNJ) Dividend Stock Analysis 2011, Web.
Finance.yahoo.com: Abbott Laboratories Common stock (ABT) 2012, Web.
Finance.yahoo.com: Johnson & Johnson Common Stock (JNJ): Business Summary 2012, Web.
Jayson, S. 2011. Here’s how Abbott Laboratories is making you so much cash, Web.
Johnson & Johnson: Johnson & Johnson Reports 2011 Fourth-Quarter and Full-Year Results 2012, Web.
Little, K. 2012. Understanding price to earnings ratio, Web.
Luesby, J. 2012. Interpreting the Price/Earnings ratio, Web.
Morningstar.com: Johnson & Johnson JNJ 2012, Web.
Motley Fool Staff: What Abbott Labs does with its cash 2012, Web.
Motley Fool Staff: What Johnson & Johnson does with its Cash 2012, Web.
MATT: Johnson and Johnson (JNJ) Dividend Stock analysis 2011. Web.
Pietersz, G. 2011. NAV, Web.
Schmidt, M. 2012. Discounted cash flow (DCF)/ NPV/ Time Value of Money concept, Web.
Sec.gov: Johnson & Johnson 2012, Web.
Sec.gov: Net Asset Value 2007, Web.
Secondventure.com: Business Valuation methods 2011, Web.
Shadunsky, A. 2012. Johnson & Johnson: Stock is fairly valued here but offers a nice sized dividend, Web.
Tyler. 2011. Dividend Growth Model, Web.
Ycharts.com: Abbott Laboratories Stock buybacks 2012, Web.
Ycharts.com: Johnson & Johnson Capital Expenditures 2012, Web.
Yee, K. 2004. Perspectives: Combining Value Estimates to Increase Accuracy. Financial Analysts Journal, Vol. 60(4):23-28.