Executive Summary
The analysis of the financial statements helps in trend relationship between internal users and external users in a company. It helps in evaluating solvency, profitability and profitability. The most common methods used for analysis are, ration analysis, common-size statements and trend analysis (Smith 67).
The financial statement gives a summary of the final audit of the Central Government for the year 2010. Though there was a 7% increase in production for Toyota Company, there have not been positive results as compared to the previous years (Codjia 1).
Major Weaknesses during the Auditing Process
The major weaknesses exhibited during auditing were due to non compliance with the existing regulations/legislations (Gun 1). Also contributing to the negative report was the large extent of neglect on the part of the systems and lack of proper internal control systems. These were some of the weaknesses:
- There were goods that had been procured but, their dues had not yet been given out.
- Non compliance with the laws and basics of cash accounting.
- Large sums of payments that had no proper records of how the processes had been undertaken.
- The recommendations of the previous years had not been implemented.
These challenges posed are always addressed by the use of performance assessments measures. The assessment measures include, revenues, capital.
Introduction
Growth process is a very crucial process in every company (Strott 1). Every industry aspires for potential growth in their company’s prospects. The demand in the world is the most significant leeway for a company to strategize on its production. This necessity should be looked into very carefully and approached in the most advanced way possible (Radeka 1). Time escalates and the needs and desire of people in terms of products and in this case automobile is advancing. This calls for new ideas in the market. Innovations are always good to go by.
Toyota Company’s has proved to score high in matters that involves innovative products and client comfort requirements. This has really brought major growth on Toyota as a motor vehicle related company (Chung 1).
Different needs, have resulted into great moves by Toyota in the world of automobile based business, vehicle manufacture and trade. For example, Toyota Company has had numerous emerging innovations (Segers 1). These innovations would bring up offers such as Mobile terminals and intelligent transport systems (ITS). The intelligent transport systems would route traffic more efficiently while the mobile terminals would provide advanced information services to drivers and passengers. This would definitely provide a tremendous growth for the company (Hino 350)
General Background of Toyota
It is the largest car company in Japan and the third largest in the whole world. Toyota motor company was established in 1937 by Japanese named Kiichiro Toyoda (Fackler1). Toyoda started this automobile company when had just come back from a brief 2 year tour from US (Linda 1). It is from his visit that he developed interest in making cars. This led to his first prototype in 1937 which he developed in his father’s workshop. The company’s move to deal in engine manufacturing was due to the scarce natural resources in Japan during after the Second World War (Craig 10). The event to power the engine machines for mobility lead to the establishment of different research centers. These were development research laboratories for nucleus power studies and the Toyoda Works.
World war two became a major setback on Japan’s motor industry especially for Toyota Company. As the economy was destabilized, it required the company to acquire spare parts of vehicles from used cars (Liker 1). This was because; basic raw material procurements became a challenge. Hence the automobile manufacturing could not be supported. This shift t did not result to an end for the Toyoda’s vision. The company came up with recycled vehicles that were not bad (Hino 52).
At the end of world war two. The war had caused severe damage on the economy. This did not deprive Toyota of its fame. The Japanese people stood with the company by having uttermost faith in it. Though there were no resources such as machines, the employees kept on hoping for the best. The trust that the people had in the company lead to its reconstruction (Gun 1). The rebirth of Toyota Company came up with new inventions. After the world war two, it was difficult for Japan motor industry to compete with other most powerful countries’ automobile industries. Therefore Kiichiro devised a way to keep on rating high in the world market (Lee 1).
As countries like USA were concentrating on large and medium sized vehicle. Japan Toyota Company opted for small cars. This provided a lot of success in the industry in the year 1947. Two years later the country’s economy became unstable and Toyota suffered a conflict between management and labor. Regulation, control and war times had the worst hit on Toyota (Morgan 256). The company suffered a liquidity crisis since it could not acquire income from the sales it made during any particular period. All that they had accumulated were losses. This affected the employees because they could no longer get their dues as it were initially. This eventually led to a strike. This resulted into a decline in production. A major reconstruction process that took place was the incorporation of a sales division in the Toyota Company, this handle all the worldwide marketing and branding procedures (Cleveland 1).
Branding and marketing was a stepping stone for the company in building a rapport with the outside clientele. The ability of Toyota to come up with new innovations also boosted the company to being ranked high among the automobiles associations worldwide. This was a positive approach that had seen Toyota develop day by day to the current state (Gun 1).
The issue of globalization also led to some effects on Toyota Company. Positive effects have been due to large exports that result into high profits. This essence of globalization also brought about avenues for marketing the company via media. This had been majorly seen in the case of the internet. This had led to high income in terms of profitability. The main challenge was on how to keep the competition at a breast so as not to be on the losing side. Negative effects were majorly due to instability in the economy (Houstin 350-352). This led to fluctuation in the prices of Euro and the Dollar not to forget specific country currencies. But the good thing is that Toyota has been able to counteract this effect for a long duration of time. This has been majorly due to involvement with employees who have high expertise especially in the automobile industry.
A brief description of Nissan Automobile Company that has been used as benchmark
Nissan Company is also one of the best selling companies in the motor vehicle company. It has been noted to be the highest rated competitor of Toyota Corporation. The ability to come up with innovations of different automobile product has made Nissan Corporation to gain trust among the world’s market at large. It is no wonder the company gets large sum of profit yearly and even when divided quarterly and so forth.
Nissan’s headquarter is in Japan. It used to brand itself as Datsun. In this year Nissan emerged as the best car manufacturing company surpassing Honda. Although Toyota still remains the Dominant, Nissan Company is slowly catching up with it. Nissan’s products also include large luxurious models which are branded as “Infiniti”. Nissan Company has expansion in numerous countries. This has provided a ground for high competition as both Toyota and Nissan want to gain popularity everywhere. To compete with Toyota company, Nissan has undergone a dramatic evolution by coming up with great main stream products that are likened to Toyota’s products. This has been noted in the world of sports (Fackler 2-5).
Because sports exploits large a number of automobile products, concentration on sport oriented products has acted as a boost for both Nissan and Toyota. Toyota has set up a benchmark which has to be surpassed by Nissan to rate high in the automobile industry. This can only happen when much is invested on the expertise option otherwise Toyota can never allow any other company to rate higher than it. Different companies can merge up and decide to work together, but this cannot be an option for Toyota and Nissan. Though Nissan is lagging behind, it has built a foundation for the future practices.
Financial analysis
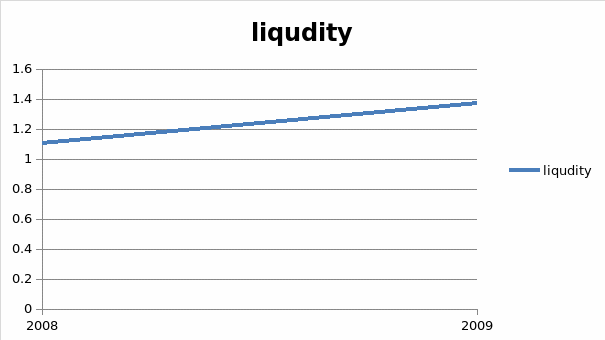
a. Liquidity ratios Liquidity ratios are used to provide information to show how a firm is able to meet its short term financial obligations (Jardim 330).
Current ratio=current assets
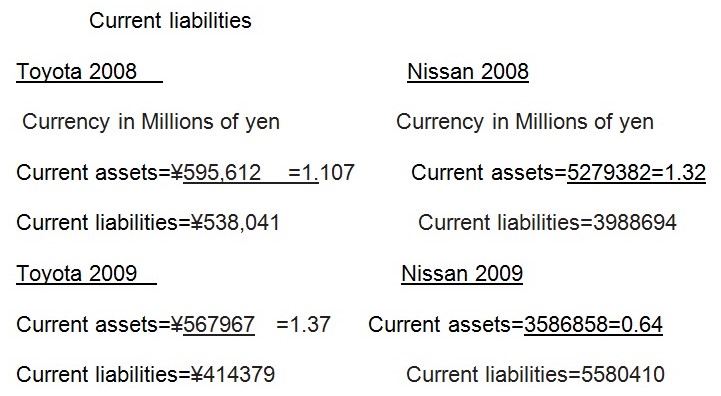
Here the firm indicates that it increased its assets in comparison to the liabilities. The company has acquired more assets so as to be in good operation.
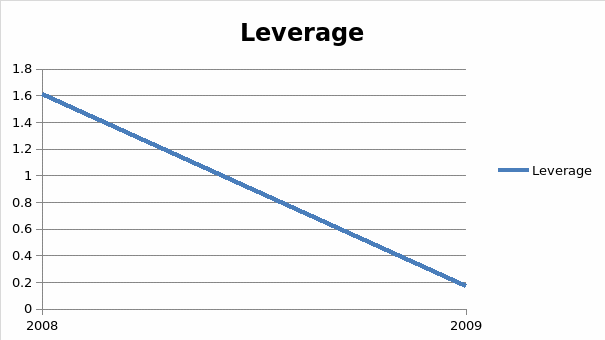
Leverage ratios
This indicates the amount of debt that is used in an effort to maximize shareholders wealth. They also measure the extent to which the firm is using its long term debt to maximize wealth. They include:
- debt ratio =total liabilities/Total assets
Toyota 2008 Nissan 2008
¥973,547/¥2,965,585=0.32 ¥8,090,039/¥ 11,939,482 =0.6776
This shows that for 0.32 of debt that was for 1 equity was used to finance the business in 2008 in Toyota while in Nissan 0.6776 was used in financing the business in Nissan this shows that Nissan had a higher reliability on debt in the year 2008 than Toyota.
Toyota 2009 Nissan 2009
¥ 1,349,762/¥ 2,327,432=0.58 ¥ 7, 199, 715,/¥ 10,214,820=0.70
This shows that for 0.58 of debt that was for 1 equity, was used to finance the business in 2008 in Toyota while in Nissan 0.70 was used in financing the business in Nissan this shows that Nissan had a higher reliability on debt in the year 2009 than Toyota.
The reliability on debt increased compared to the previous year.
Debt to equity ratio
=long term debt/common equity and this shows the proportion of long term debt that is used to finance common equity.
Toyota 2008 Nissan 2008
¥ 973,547/¥ 602,783=1.615 ¥3,324,793 /¥3,556,479 =0.93
This shows that for every yen that common equity uses in financing the firm use of long term debt which shows that in the year 2008 Toyota had more reliance on debt to finance its equity as compared to Nissan.
Toyota 2009 Nissan 2009
¥ 935,382 /¥ 548,264 = 0.17 ¥ 3,324,793 /¥ 3,556,479=0.935
This shows that for every yen that common equity uses in financing the firm use of long term debt which shows that in the year 2009 Nissan had more reliance on debt to finance its equity as compared to Nissan.
In comparison to the previous year the firm has decreased its reliance on long term debt and increased reliance on equity.
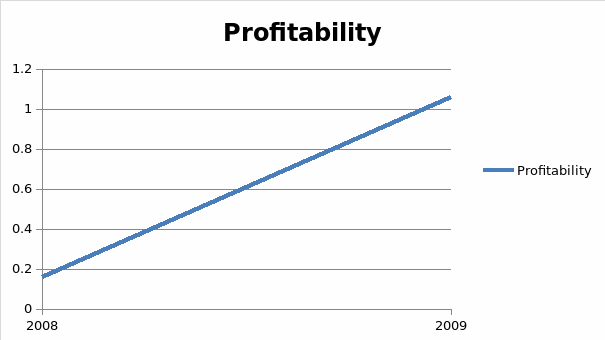
Profitability ratios
These offer different measures of the firm’s ability to generate profits. They usually include:
Gross profit margin = (sales-cost of goods sold)/sales.This shows how the gross profit has earned on the sales.
Toyota 2008 Nissan 2008
¥322,043 /¥ 2,000,536=0.161 ¥195,249 /¥1,584,252 =0.12
This shows Toyota has a higher value than Nissan hence shows that the firm has used its assets effectively in generating profits. N/B a higher percentage is always better.
Toyota 2009 Nissan 2009
¥ 195,249 /¥ 1,584,252 =1.06 ¥ 1,371,058 /¥ 7,517,277 =0.18
This shows Toyota has a higher value than Nissan hence shows that the firm has used its assets effectively in generating profits. N/B a higher percentage is always better. Performance of the company in generation of sales improved compared to the other year.
Activity ratios
These ratios indicate how quickly a firm is able to collect its accounts receivables and pay its accounts payables and is always reported in number of days (Codjia 1). These ratios may include the following
Average inventory =inventory/(annual cost of goods sold/365)
Toyota 2008 Nissan 2008
¥ 124,633 /¥ 1,678,493/365 =27.1 days ¥ 498,423 /¥ 8,436,974/365=21.56 days.
When you compare Toyota versus Nissan rate Nissan seems to fair well in terms of paying and receiving money takes almost 6 days less.
Toyota 2009 Nissan 2009
¥ 0 units /¥ 1,389,002/365 =o ¥ 540,407 /¥ no inventory6,146,219/365=32days
When you compare Toyota versus Nissan rate, Nissan seems to fair well in terms of paying and receiving money.
Average collection period=accounts receivables /average daily sales
Toyota 2008 Nissan 2008
¥ 244,035 /¥2000,536/365=44.52 ¥ 429,078 /¥ 8,436,974/365=18.56
When you compare Toyota versus Nissan rate Nissan seems to be efficient in terms of collecting its receivables as compared to Toyota in the year 2008 by almost 26 days.
Toyota 2009 Nissan 2009
¥ 169743 /¥1584252 /365 =39.11 ¥ 641154 /¥7517277 /365=31.13
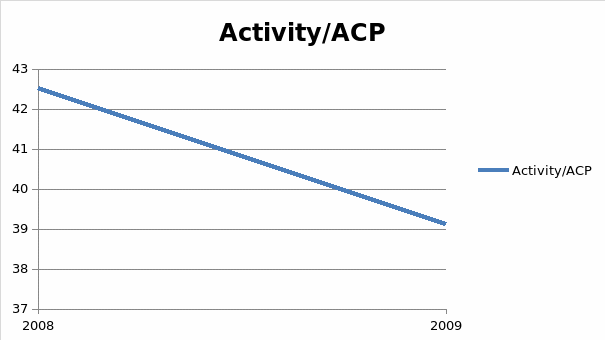
When you compare Toyota versus Nissan rate Nissan seems to be efficient in terms of collecting its receivables as compared to Toyota in the year 2009 by almost 8 days.
In comparison to the previous year Toyota reduced the number of Days of collecting its receivables thus improving efficiency.
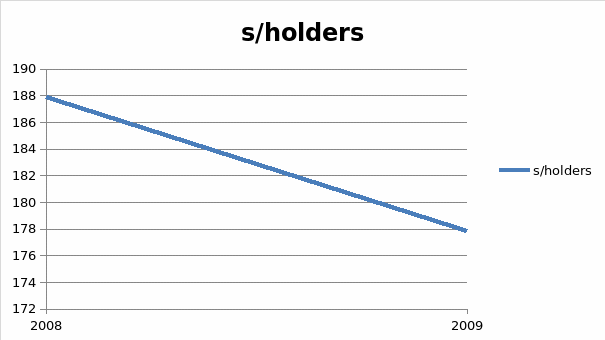
Shareholder ratios
These ratios are used to show the amount that a company borrows compared to its shareholders and also shareholding (Liker 200). They include the following;
Gearing ratios=(long term liabilities +short term +overdraft)-cash x 100
Shareholders fund
Gearing ratios are used to show the amount the company has in comparison to the shareholders funds.The result is a percentage.If the percentage is low this will show that the company is being relatively financed by equity, but if it shows a high percentage this will show that the company is comparatively being financed by a large debt, which shows overreliance on debt (Ohno 1).This is bad to the company when interest rates are high.
Toyota 2008 Nissan 2008
(973,547+538,041)-115,557)/602,783×100=231.6 (3324793+3988694)-632714)/3556479) x100=187.84
Toyota has a higher interest rate than Nissan thus shows it depended a lot on debt in the year 2008.
Toyota 2009 Nissan 2009
(935382+414379)-169743)/548254) x100=215.23 (3856858+3342857)-802410)/3598966×100=177.8
Toyota has a higher interest rate than Nissan thus shows it depended a lot on debt in the year 2009
In comparison to the previous year it indicates that the dependence on debt decreased in the current year.
Key
- Y- Axis represents percentage ratio
- X- Axis represents year
Conclusion
From the above ratio calculations in the 2 years, in the liquidity ratio we see that the company improved in the liquidity ratio performance to mean that they acquired more assets which as a result was able to work in their favor since they were able to meet their short term obligations
In the leverage ratio that was calculated debt ratio, it is indicated that the debt ratio in the year 2009 increased which shows the firms increased reliance on debt as a major source of finance to acquire more wealth for its shareholders , rather than raising from its equity sources like from shareholders.This is particularly risky in times when there is volatility in the market.The firm may end up paying high interest rates when the company is repaying its debts especially during the inflation periods.
In the profitability ratio of gross margin we observe that the company performed fairer since the firm was able to earn more profits in the year 2009.This is majorly attributed to by the firms acquisition of more assets which were able to be traded to yield profits for the firm. These profits may also be used to fund its operation, and reduce its dependence on debt.
As observed in the activity ratio of average collection period we observe in the year 2008 the collection period was high.This indicates that the company’s methods of sales and collection from their debtors were not effective, hence were not favoring the company which led them into more debt. However in the year 2009 we observe that the collection period improved by being reduced as a result the firm was able to have more cash at hand and was able to finance its operations more effectively.
In the shareholders ratio we observe that the company’s financing between was improved from insider funding such as shareholder funding rather than debt. This is majorly attributed to the firm’s ability to effectively collect its receivables and used the proceeds to finance its operations, which aided the firms performance as compared to the previous year.This indicates an upward trend in the periods operation. The summarized ratios are basically used in measuring the performance of a company in the various financial years. These enable the company to compare its performance to the previous years.
Recommendation
The firm should have a balanced financing which includes its share holders funds and as a result will be able to reduce the cost of borrowing.Since borrowing may sometimes be affected by increasing rates (Rank 1).The firm should also be able to increase its efficiency in collecting debt since the increase in debt would mean that the firm has no available funds to finance its operations. The firm should also be able to consider financing through debt which has no risks associated and have flexible payment patterns and can be used to maximize the shareholders wealth (Smith 48-52).
Works Cited
Cleveland, John. System of Production. Lean development System, 2006. Web.
Codjia, Marquise. “Money: Components of Long term Debt”. Ehow Journal 1.5. (2011): Print.
Craig, Shacher. “Toyota First half Financial Results for 2010”. Toyota in Action 1(1): Print.
Chung, Victor. “Toyota’s History”. Toyota Journal 3.14 (1995): Print.
Fackler, Martin. “Toyota: New Generation Foreign Managers”. New York Times. 2011: Al. Print.
Gun, Aichin. “Toyota’s History”. Toyota Archives Journal 1.4 (2011): Print.
Hino, Satoshi. Inside Toyota’s Mind. Tokyo: Diamond Inc., 2009
Houstin, Cliff. Requirements for a financial analysis. New Jersey: John Wiley & Sons, 2011.
Jardim, Ann. Creation of Toyota. Massachusetts: Massachusetts Institute of Technology Press, 2003.
Lee, Mary. Toyota Corporation: Income Statement. Stock analysis on Net, 2010. Web.
Liker, Jeffrey. “Toyota Management”. The Toyota Way Journal 3.1(2009): Print.
Liker, Jeffrey. Toyota Management Quality. New York: McGraw-Hill, 2003.
Linda, Evans. Financial Summary. FY2010 Second Quarter, 2009. Web.
Morgan, James. Development System of Toyota Products. Michigan: Productivity Press, 2006.
Ohno, Taiichi. Toyota beyond Large Scale Production. Seneca: Productivity Press, 1998.
Radeka, Katherine. “Toyota: Product Development”. Find Articles Journal. 24.3 (2000): Print.
Rank, John. “Toyota Motor Corporation- Information Profile and Background”. Reference for Business Journal 2.4 (2006): Print.
Segers, Rien. A Novel Japan: 21st Century. New York: Routledge Pub., 2008.
Smith, Preston. Flexibility: Product Development.Carlifonia: Jossey-Bass, 2007.
Strott, Elizabeth. “Toyota Sales”. MSN Money Journal. 6.3 (2007): Print.