Introduction
PepsiCo is a global company with a total of 22 brands, which generate at least $1,000 million each as retail income for one year. The firm makes hundreds of foods as well as beverages which have well respected household names globally. PepsiCo unites people through their unique dedication to sustainable development as they invest to ensure that the planet and the people have a healthier future (PepsiCo, 2012). Currently the firm is making over $65 billion as net revenue and with its dedication to sustainable development the firm will be able to have a successful future. This is, “Performance with Purpose” where the company promises to offer a broad assortment of beverages and foods for the local tastes (PepsiCo, 2012). It also seeks to locate inventive ways to reduce any impact to the environment.
The firm focuses on investing in their region of operation through great workforce, support as well as respect of the local communities (PepsiCo, 2012).
The firm has been operating in a volatile environment for the last five years and it has been able to deliver a double-digit annual compound growth in the core net income, a 8% annual compound growth in the core Earnings per Share (EPS), as well as an income of approximately $30,000 million to owners in form of share repurchases and dividends (Cable, 2012). The major goal of the firm is to continue with such earnings trend in the long-term for approximately five to ten years, by making changes where necessary in order to address the identified challenges. For the current year 2012, PepsiCo will be focussing on suitable process that will make it very strong and more successful in the future. Considering that the year ended 31st December 2011 the firm made $66.5 billion as net income which is an increase of 15% compared with 2010 and a 3% increase in EPS to $4.03 compared with 2010 (Cable, 2012).
Therefore, this paper will discuss the share price reaction to external factors or information as a result of investors’ reaction to such factors. It will also value the firm and finally give a recommendation to an investor who is considering PepsiCo as a potential company to include in his/her portfolio.
Shareholder value
Besides serving its customers, PepsiCo is dedicated to adding value to the shareholders through several approaches; upholding a well-built structure together with controls, concentrating on understandable financial performance indicators and carefully implementing reliable risk management (Cable, 2012). This leads to creation of sustainable growth as well as delivering high shareholders returns. PepsiCo uses excess cash to maximize owners’ value in various ways for instance; dividends, share repurchase and acquisitions (Cable, 2012).
Revenue
PepsiCo has experienced a hold up in growth for the three financial years (2007, 2008 and 2009), but in 2010 the revenue increased by 33.79% to $57.838 billion while in 2011 it increased by 15%. This implies that the firm was healthy leading to expansion as most of the money was used to maximize the shareholder’s value. The increase in revenue in 2010 was as a result of the acquisition of its bottlers in North America. For the last five years the income increased by 13.87% to $6,443 million while cash flow increased by 29.06% to $8,944 million (MATT, 2011: Morningstar, 2012).
Dividends
The dividend strategy for the firm is to payback excess cash to the owners through dividends as well as capital gains. The major element in shareholders wealth creation is the growing dividend policy (MATT, 2011). For the last five years to December 31, 2011 the firm’s dividend has grown by 42.11% from $1.425 in 2007 to $2.025 in 2011 as shown by Table 1 (Finance.yahoo, 2012). The firm has been confident in its strong and flexible business model that has allowed it to decrease its yearly dividend cover steadily; for 2011 the firm continued with the trend and reduced its cover to 1.99 times.
PepsiCo is presently providing a dividend yield of 3.10%. In the past it was hard to find the firm’s stock offering more than 3% as yield, but as a result of the current market dip and the firm’s dividend rise the yield is currently more than 3% (MATT, 2011: Finance.yahoo, 2012).
Share repurchase
For three years (2006, 2007 and 2008) the firm had $9,000 million net share repurchase and in 2010 the firm approved a share repurchase worth $15 billion by the year 2013, which represents approximately 15% of the common stock considering that it has a market capitalization of around $100 billion (Proactiveinvestors, 2010: MATT, 2011). In 2010, the firm made $5,600 million as voluntary contributions to the pension and a share repurchase of $4,400 million in the common stock. And the listed group in NYSE authorized an acquisition of shares not worth more than $6,400 million by June 2010 (Proactiveinvestors, 2010).
The move was an early indication towards an emerging trend at the time where the S&P 500 firms were holding a lot of cash following the cutting of costs and restricting expenditure for 18 months. PepsiCo fared reasonably well throughout the recession since it provided small-scale luxury things which the customers were reluctant to renounce. These luxury things turned out to be staples in customers’ lives globally (Swanekamp, 2010).
Balance sheet
The firm took on a significant gearing so as to develop its business by acquiring its bottlers in North America. The significant growth for the 2010 and 2011 income statement had a cost in form of liability. In 2010, the firm’s debt/equity ratio was at 94% while the owners’ equity consisted of around 70% goodwill. The firm’s interest cover is around 11 times which is promising and in general it has a firm balance sheet. Pepsi has been using the earnings to pay its debt and stabilize their financial position over time, thus this money is not used to buy back shares and pay dividends to shareholders (MATT, 2011).
Investment
In the year 2010, PepsiCo merged with Pepsi Bottling Group and PepsiAmericas in order to consolidate its base and expand it target market. The competitor, Coca Cola did the same and bought its largest bottler in North America. PepsiCo used this strategy in order to improve its sales in North America and consequently revenues. As presented by Chart 1 the income improved but destabilized its financial position because the firm had to use more debt to fund operations, in addition to acquiring significant goodwill (MATT, 2011).
The activities over the past few years show that PepsiCo appears to have realistic management team. The huge beverage firm, Coca Cola, has in reality been catching up with PepsiCo in form of business activities since PepsiCo started making improved acquisitions long before Coca Cola (MATT, 2011).
Risk management
PepsiCo works in a comparatively defensive industry or sector and has a better-quality management team. Risks exist and no firm is immune to such exposure. The firm’s profit relies on the costs of transportation and commodity. The soda consumption trend is downward sloping in the North America which implies that Pepsi has to constantly restructure its business with better alternatives in order for it to be successful in the future (MATT, 2011). It also faces problems when using water, which is scarce in some countries thus causing environmental and political issues when the firm utilizes a lot of water in any given region. The increased debt thus gives Pepsi minimal cushion to take care of downturns and other issues. Therefore, the firm must correctly operate at a lower value than Coca Cola that is also highly geared but not to a large extent like PepsiCo (MATT, 2011).
Growth strategies
In order to attain growth PepsiCo has focused on six strategies for long-term growth which include; (1) the firm seeks to attain global leadership. Pepsi leads globally in snacks manufacturing in all key region of its operations. In at least 40 developing and developed regions the firm has privileged positions across the whole value chain. Because they capitalize on the local manufacturing as well as optimized go-to-market abilities in every operational region, and have the capacity to institute locally significant products utilizing international capacities. The firm has considerable growth opportunities to expand to new regions as well as make healthier snacks through the use of heart-healthier oil, extra whole grain, seeds and nuts and sodium reduction (PepsiCo, 2009).
The firm ensures there is sustainable growth in international beverages. The acquisition of the bottlers in North America created a strong supply chain, improved innovation capacities and expandable go-to-market system. The move combined with refreshed brands increased the firm’s profitability as well as growth, especially in emerging markets in the year 2010 (PepsiCo, 2009).
The firm is in a position to control two unusual consumer categories which are more relevant to many retailers in the world. The firm’s products are profitable and deliver outstanding cash flow because they create retail traffic. The firm has been using its portfolio to generate value for the customers as well as deliver high top-line growth to the retailers through the use of a powerful supply chain as well as back-office synergies to enhance profitability and customer service.
The firm is rapidly expanding its “Good-for-You” Portfolio through the use of the science-based innovation obtained from R&D capacities, which they had accumulated for many years and from joint ventures and acquisitions (PepsiCo, 2009).
Is commitment to environmental sustainability; the firm is doing all it can to conserve the environment especially the natural resources such as water and also reduce the consumption of fuel and electricity usage. Most of its businesses are utilizing innovative methods so as to be considerably more effective in utilization of the energy, land, packaging and water. To achieve this, the firm is working together with the local people in their areas of operation (PepsiCo, 2009).
Finally, the firm has a unique talent base in all of its business areas and as it expands the business it has placed keen focus on maintaining a general environment as well as on improving the associates’ careers in order to have leadership capabilities, talent and experience needed to grow its businesses in the future. For instance, the firm is carrying out custom-made training programs that will offer senior executives as well as managers with strategic leadership competences needed in a dynamic environment (PepsiCo, 2009).
Past performance
Market Value Added (MVA) can be used to measure past performance or the created value of a company since it uses the stock market to determine the value added to the owners. It is determined as follows:
- Market Value of Equity = shares issued x share price
- MVA = Market Value of Equity – Book Value of Equity
In 2007, the firm’s value was very high compared with the following years but as from 2008 the value of the company increased gradually by 32.03% from $77,895 million to $102,844 million in 2011 as indicated by Table 2. The high value shows that the company will be able to create more value to the shareholders in the future as assessed by the stock market.
Shareholders are compensated in terms of capital gains and dividends as shown by Table 3; where the capital gains rely on the investment policy while dividends rely on firm’s dividend policy. Therefore, the shareholders total return is determined by adding the two together.
The investors earned high returns in 2007, but low returns in 2008; this may have been as a result of the global recession which took place during that period. Ever since 2009 the shareholders’ return decreased dramatically by a margin of 10.18% to 3.74% in 2011. This implies that in 2011 the share price did not fluctuate much, as a result the shareholders earned small amount of cash in terms of capital gains.
Market Value of Equity
PepsiCo has a market capitalization of 99.98 billion and for the last 12 months its stock attained a price range of $58.50 to $71.89 and closed the day at $63.95 on February 10, 2012 (Finance.yahoo, 2012: Cable, 2012). On February 10, 2011 the firm’s stock was selling at $63.36 but dropped by 0.03% to 63.34 on February 14 and then increased by 1.72% on March 10 (Finance.yahoo, 2012). This implies that the price did not fluctuate much in that one month. The reaction of the share price was probably as a result of change in the analyst Davenport’s opinion on Feb 10 in which he downgraded the shares from a buy opinion to neutral.
It can also be as a result of insider transactions where some of the officers acquired shares; others did not open market, while others issued ownership statement. On March 2, dividends were paid at $0.48 per share and the price was pushed slightly higher to $64.65. During this period the firm made two key developments; (1) commented on the EPS for the year 2011 and the long-term EPS (2) as well as made an announcement to launch U.S. and Russian tender offers, which may have contributed to the share price trend.
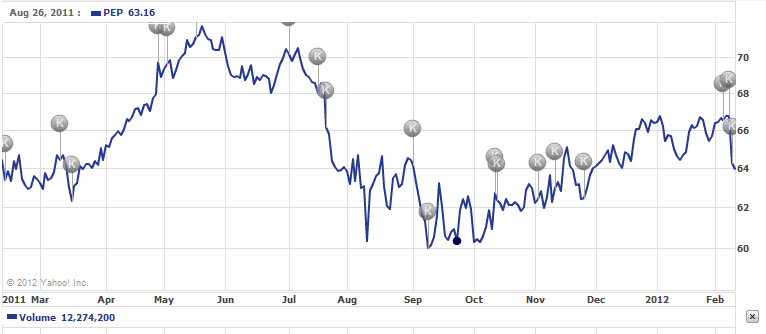
The stock price decreased to a low of $62.31 on March 16 and then increased gradually to $71.89 on mid-May, which was the highest share price for the last 12 months representing an increase of 15.37%. This implies that those investors who bought the stock at $62.31 and sold it at $71.89 earned capital gains of 15.37%. This type of trend shows that the market was bullish since many investors were purchasing the stock forcing the prices up, that is to say the demand for the stock was very high but the supply was low. The increase in price was mainly attributed to an announcement made by the firm on March 16 to carry out a joint venture with Strauss Group plus another comment on long-term EPS and reaffirmation of 2011 EPS launching $1,750 million two section debt Deal-DJ (Finance.yahoo, 2012). In addition from May 3 to May 16 there were some insider transactions in terms of Option exercise by the firm’s officers.
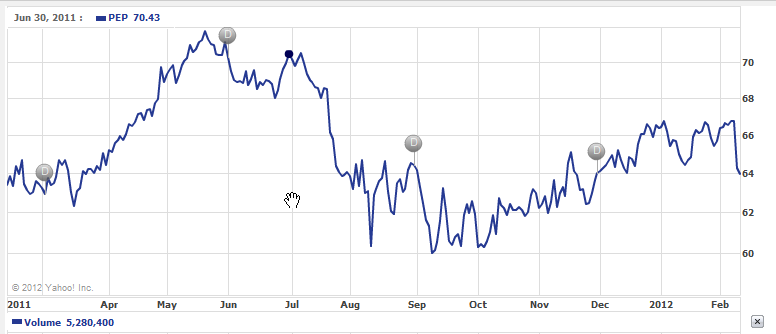
From mid-May the investors started to sell their shareholding rights thereby forcing the prices down; thus, the supply of stock was very high compared with the low demand. Dividends were paid on June 30 leading to a drastic decrease in price. The share price dropped to a low of $60.32 on August 10, this trend indicates that the market was bearish. Therefore the share price dropped by 19.18% implying that any investor who bought at $71.89 and sold at $60.32 lost 19.18% as capital gains. On July 1 the firm opted to buy the remaining shares in the Russia’s Wimm-Bill-Dann Foods-DJ on July 18 since it planned to do a joint venture between Grupo Embotelladoras-DJ and Mexico Beverage (Finance.yahoo, 2012). This also raised its 2011 EPS on July 21; these activities may have contributed to the decrease in price as well.
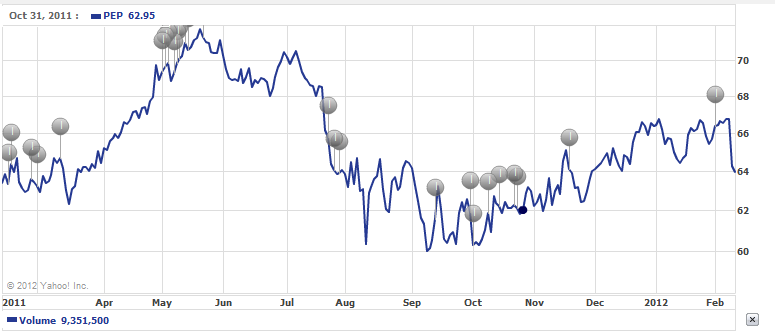
The insider transactions did not change the stock price trend. The prices increased by 7.11% to $64.62 on August 16 and then dropped to a low of $58.50 on October 4, a decrease of 9.47%, which was the lowest price attained in the last 12 months. The decrease in price was probably as a result of the authorization of the Grupo Embotelladoras Unidas SAB de CV by Pepsi for the business integration, announcement on completion of the Vimm-Bill-Dann Produkty Pitaniya OAO acquisition and dividend payment. The analyst, Stifel Nocolaus, changed its opinion from the acquisition to hold leading to an increase in price. The stock price assumed an upward trend but the price of share increased little by little and attained a high price of $66.74 on January 4, 2012 and then decreased by 3.51% to $64.40 on January 13 (Finance.yahoo, 2012). This implies that the insider transactions, the key developments and dividend payments did not have much effect on the share price.
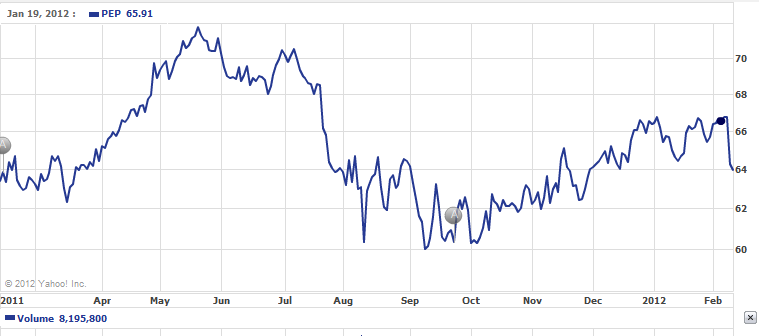
And on February 8 the price increased by 3.51% to $66.74 and dropped by 4.18% on February 10, to $63.95 as a result of the possibility of withdrawing from the acquisition of Brazilian cookie maker, the Marilan Alimentos, by the firm (Finance.yahoo, 2012). It may also be as a result of the fine charged to the firm by the Greece for abusing the market position and the firm’s announcement to layoff some employees and its plans to raise dividends as well as share repurchase.
Valuation
Net Asset Value (NAV)
NAV = (Fixed assets + current assets) – (long-term liabilities – current liabilities)
NAV = Total assets – Total liabilities
= $72,882 – $51,983 = $20,899 million
Value per share = $20,899/ 1865 = $11.21 per share
The firm’s market capitalization is $99,980 million. Compared with NAV of $20,899 million it appears that the NAV is lower than the market capitalization by $79,081 million this is as a result of three reasons; first, the present value of assets probably is different from figures in the balance sheet, used to determine NAV which are historical in nature. Second, NAV explains the firm’s current liabilities and assets position. An investor may deem that the firm has considerable growth potential, and they would be ready to part with more cash for the firm than for its NAV. In addition, the accounting principles as well as interpretations differ globally making it hard to compare firms in different regions. Finally, some intangible assets like goodwill are most of the time not included in the NAV calculation as shown by Table 4 (Pietersz, 2011). Since the market capitalization is higher than NAV then PepsiCo is more profitable and can be able to survive in the future.
Price/Earnings ratio
P/E ratio indicates how much an investor is prepared to pay for the company’s shares given its current EPS (Loth, 2011). It indicates the payback period that is the number of years the investor will take to recover his investment in shares of the firm from earnings generated by that share. The ratio also indicates the future performance of the company and the relative risk of the firm where firms in the same risk class will tend to have the same P/E ratio (Loth, 2011).
P/E ratio = Share price per share/ Earnings per share (EPS)
EPS ratio indicates the amount shareholders expect to generate in form of earnings for every share invested in the firm. It indicates the profitability of the company on a per share basis (Meir, 2008). In this case, the CNBC (2012) predicts that the firm EPS will grow by -7.3% while based on PepsiCo (2012) its core EPS will grow by -5% for the year 2012, for this case let us take the average growth of -6.15% [(-7.3% + -5%)/2 = -6.15%]. Thus, the firm’s EPS for the 2012 will be $4.13 ($4.40 x 93.85%=$4.13). This means that for every share invested in PepsiCo, will generate $4.13 of the firm’s earnings. Also based on CNBC (2012) the forward looking P/E is x15.4 this means that the share price after one year most probably on February, will be around $63.60 (4.13 x 15.4 = $63.60).
Forward P/E ratio = $63.60 / $4.13
= x15.40
While using trailing EPS of $3.99 and share price as at January 31st 2012 of $65.67, the trailing P/E ratio will be 16.46 times ($65.67/$3.99= 16.46).
The firm’s trailing P/E multiple indicates that PepsiCo stock, at a share price of $65.67, was dealing at 16.46 times the firm’s net EPS of $3.99. While the forward P/E multiple indicates that at a price of about $63.60 the firm will be dealing at x15.40 the company’s net EPS of $4.13. This implies that an investor would be parting with $16.46 or $15.40 for each dollar of PepsiCo earnings. It also means that the investors would take 16.46 or 15.4 years for 2011 or 2012’s earnings respectively to recover his initial investment in the shares from the earnings generated by that investment in the firm.
Compared with the competitors in the non-alcoholic beverage sector with market capitalization of more than $90 billion we can say that PepsiCo has a high P/E ratio since it is above the industry average and the market (S&P 500) as shown by Table 5. A share with a superior P/E ratio proposes that the investors are anticipating superior returns growth compared with the general market, as the investors are parting with more cash for today’s returns in expectation of an increase in future earnings. Therefore, any share with such traits is deemed as growth stocks. On the other hand, a share having low P/E proposes that the investors have reserved anticipations for returns increase in future compared with the general market (Loth, 2011). Therefore, PepsiCo can be classified as growth stock and can only attract growth investors who view such a stock as an attractive buy.
Conversely, value investor may not be inclined to acquire the growth stock because he/she consider it to be overpriced and will instead prefer underpriced stocks that can be sold at bargain price that will over time perform well. But the investors should not base their investment decisions using only P/E measure because that depends on the underlying figures quality (Loth, 2011).
Discounted Cash Flow
The firm expects that in the financial year 2012 the operating profit will increase by 6-7% from $9,633 million to $10,307.31 million (PepsiCo, 2012); let us assume it will increase by 7%. The firm will save $500 million in productivity program which is treated as revenue. In order to forecast the future cash flows the percentage-of-sales method is used to determine cost of sales, amortization of the intangibles and interest expense, these items are linked to sales. Therefore, revenue for the year 2012 will be $72,888.99 million which is an increase of 9.6%. Assume that the firm’s other incomes including interest income will increase by 2438% to 1446.69 million as shown by Table 6. In addition the firm is expecting that its tax charge for the year 2012 will be 27% (PepsiCo, 2012).
The firm is expecting to obtain $6,000 million and $8,000 million as management and operating cash flows respectively for the financial year 2012. In addition the firm is expecting to expend about $550 million as cash expenditures (PepsiCo, 2012). Thus, this figure is subtracted from the total cash flows to obtain Free Cash Flow (FCF). The FCF is then discounted at the owners’ required return rate to obtain the value of the equity. Since the firm is a going concern that will ideally continue to perpetuity the value of equity will be determined as follows:
- Value of Equity = Free Cash Flow/ Discount rate
- Present value (PV) of perpetuity = FCF x 1/ discount rate
- PV = 13,450 million x (1/ discount rate)
Assume total equity for 2012 will be $28,560 million this means that required return will be 24.54% as shown by Table 7 considering that the firm will raise its share repurchase to no less than $3,000 million and the dividends will be raised to $2.15 for every share which is an increase of 4%.
PV = 13,450 million x (1/ 24.54%)
= $54,808.48 million
Value per share = $54,808.48/1865
= $29.39 per share
Gordon (dividend) growth model
Another way to determine a good stock that will yield good dividends to the investors is by making use of the Gordon (Dividend) Growth Model. The investors can determine the stock’s value by use of dividends that offer the investors returns that they require making it worthwhile for purchase. The model value the firm’s equity based on assumption that the stock of the firm is worth more if the future earnings as dividends are discounted. That is to say, the model is utilized in stock valuation based on future dividends net present value (Marquit, 2011). The model is determined as follows:
P = D1 /(r – g)
Where P is the current value of the stock, D1, r and g are dividend to be paid this year (2012), firm’s cost of equity and dividend growth respectively. It can also be expanded to look as shown below:
P= [(Current dividend x (1 + g)] / (required return – g)
= [(2.025 x (1 + 4%)] / (24.54% – 4%)
= $10.25 per share
Basically, Gordon model implies that the firm’s stock should be priced at $10.25 so that the investor can earn 24.54% per annum, based on the model’s dividend growth. It may also be interpreted to mean that PepsiCo is presently overvalued, because it appears to show that PepsiCo has a high price compared with its valuation.
All models have their delimitations and Gordon model is not an exception. The dividends to be paid to the shareholders may not remain constant because the firm may reduce them. Thus, dividend growth cannot remain stable, and Gordon model presumes a steady growth in case of perpetuity (Marquit, 2011).
Reconciliation
The NAV, P/E ratio and DCF as well as Gordon Growth Model show different values. This means that they give dissimilar values and there is no method that is decisively the most accurate. Therefore, in such a situation just like “beauty lies in the eyes of the beholder” the value will thus depend on the user. In addition no method technically dominates in any circumstance, thus many techniques can be used in any context. In order to come up with an average figure these values can be combined through the use of weights (Yee, 2004). In this case, the cash flows estimates are more reliable because that is part of the PepsiCo strategic plan for the year 2012 and thus more weight will be allocated to DCF let say 55%. NAV, P/E ratio and Dividend growth model will be allocated 15% each. Therefore, the firm’s combined estimate (Vce) is determined as follows:
Vce = (11.21 x 15%) + (15.40 x 15%) + (29.39 x 55%) + ($10.25 x 15%)
= $1.6815 + $2.31 + $16.1645 + $1.5375
= $21.6935 or $21.69 per share
Value of equity = 21.69 x 1865 shares = $40,458.38 million
Conclusion
PepsiCo is a growing firm and has a growth stock, therefore any investor willing to invest in such a stock can do so as it also has a high value of equity. And a good thing is that, any investor investing in PepsiCo is guaranteed returns in terms of share repurchases and dividends, which give the shareholder a comparatively secure return which also indicates that the firm is principally focused on creating shareholders’ value. But a value investor should not buy the stock because it is overpriced by the market at $65.67 per share when compared to $21.69 per share.
References
Cable, J 2012. PepsiCo to cut 8,700 jobs, reduce management layers in global productivity drive, Web.
Cnbc. 2012. PepsiCo Inc, Web.
Financials: PepsiCo 2012, Web.
Loth, R 2011. Investment valuation rations: Price/Earnings ratio, Web.
Marquit, M. 2011. The dividend growth model, Web.
MATT: PepsiCo (PEP) dividend stock analysis 2011, Web.
Meir, L 2008. Financial ratio analysis, Web.
Morningstar: PepsiCo, Inc. PEP. 2012, Web.
PepsiCo: PepsiCo report fourth quarter and full year 2011 results, 2012, Web.
PepsiCo: Letters to shareholders. 2009. Web.
Pietersz, G 2011, NAV, Web.
Proactiveinvestors: Pepsi increases share repurchase program to US$15 billion. 2010. Web.
Swanekamp, K 2010, Pepsi buyback is part of a trend. Web.
Yee, K, 2004, ‘Perspectives: Combining Value Estimates to Increase Accuracy’, Financial Analysts Journal, Vol. 60 no. 4, pp. 23-28.
Appendices
Table 1: Dividend growth
Table 2: Market Value Added
Table 3: Total Shareholder Return (TSR)
Table 4: Net Asset Value
Table 5: Competitors
Table 6: Projected Income statement
Table 7: shareholders required return