As informed, Pampers Health Spa (PHS), located 10 miles from Birmingham city, is engaged in the luxury spa and hotel business. Apart from two hotel spas, there are no other stern competitors within the vicinity. PHS operates 48 weeks in a year and although it has the capacity to accommodate 420 guests per week yet the occupancy rate is 70% only. According to the ongoing offer, if a problem of a guest is not solved within 20 minutes, he/she will be allowed a free stay the next time he/she visits the hotel. PHS has a bar and food lounge and snacks can be ordered round the clock. As such, PHS boasts of having a perfect place for organizing meetings. The Marketing Manager of PHS has been able to crack good deals with the food and beverage supplier and the local newspaper. PHS gets a 30 days credit on all the food and beverages. The local newspaper displays advertisement of PHS regularly in order to promote the business.
Price Elasticity of Demands
“The price elasticity of demand can be applied to a variety of problems in which one wants to know the expected change in quantity demanded or revenue given a contemplated change in price.” (Netmba, n.d.). As per the information provided, the price elasticity of demand is ‘2’. This is not a good sign. Because the price elasticity of demand should be less than ‘0’ if a business is doing good. Basically, price elasticity of demand means the effect of the rise in prices on the demand (sale). If the price elasticity of demand is more than ‘0’ means that any increase in the price will directly have a downward trend in the demand or sales. And vice versa, if the price elasticity of demand is less than ‘0’ means that an increase in the price will not affect the sales or demand. “The higher the price elasticity, the more sensitive consumers are to price changes. Very high price rice elasticity suggests that when the price of a good goes up, consumers will buy a great deal less of it and when the price goes down, consumers will buy a great deal more.” (Moffatt, n.d.).
PHS should try and reduce this number. This can be done by reducing the price. Like for instance, the present price is 210 (when rounded off). In order to make the price elasticity of demand ‘-1’, PHS will have to decrease the price to 150. This price will be a little less than double the cost price. If the price is decreased, the sales will increase and probably the present losses will converted into profits. So this seems to be logical.
Analysing the Trading, Profit & Loss Account
The Trading and Profit & Loss Account of PHS shows that the company is under heavy losses. The only reason visible is that the fixed costs are on the higher side. Of course the losses can also be prevented if the sales are more. Sales can be increased by two ways. Firstly, by increasing the selling price and secondly, by increasing the customer base. The price cannot be increased because the price elasticity of demand is already 2. Further increase in the price will result in a decrease in the customers. In order to increase the customers, the management has to either reduce the price or venture to start some additional facilities. Another option might be that the management should try and reduce the fixed costs to a great extent. The two main heads are ‘Premises’ and ‘Wages and Salaries’. These two expenses should be curtailed.
Analysing the Breakeven Point
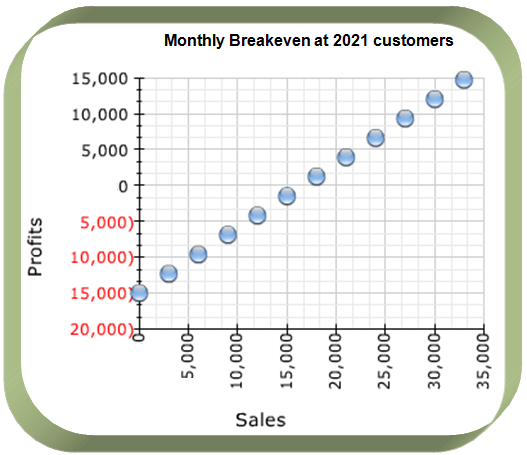
“The break-even point has its origins in the economic concept of the ‘point of indifference’. From an economic perspective, this point indicates the quantity of some good at which the decision maker would be indifferent, i.e., would be satisfied, without reason to celebrate or to opine. At this quantity, the costs and benefits are precisely balanced.” (Enotes, n.d.). Presently, PHS caters to 1176 customers per month. An article in ‘NowLetsGetStarted’ explains the breakeven point working as follows, “If your business depends upon a high number of low value sales you’ll probably want to work on a weekly or even a daily sales target so you exceed your breakeven point. If your business does not work on high volume sales a monthly figure for sales target setting and measurement may be enough.” (NowLetsGetStarted, n.d.). Calculation of the breakeven point shows that in order to reach the no profit no loss situation, PHS has to cater to at least 2021 customers per month. It means a gap of 341 customers and a shortfall of almost 16.87%. According to the available capacity, PHS can accommodate 1680 customers monthly. This gap of 504 in the available and utilized capacities that is lying waste should be tapped by the management. In doing so, no additional fixed costs will be incurred. Moreover, if the complete capacity is utilized, PHS will start earning profits. In order to cover all the monthly expenses, PHS will have to make sales of £424,683 (taking 2021.2 as the breakeven point) per month. And in order to make some profit, more than 2021 customers will have to be catered to. Following is a graph of the breakeven point of PHS.
Importance of Breakeven Point
Without calculating the breakeven point, a businessman cannot know as to how much amount he/she has to earn in order to cover his/her basic running costs. And also the sales figures to be achieved in order to earn that particular amount.
Breakeven point is very crucial to any business plan. It gives a person the explicit targets of sales that his/her company has to achieve and will help him/her in monitoring the progress of his/her company.
As is the case with PHS, if the breakeven point is greater than the present sales, profit is out of question. In such cases, the following remedial measures can be taken.
- Increase the sales
- Increase the selling price
- Increase the rate of recurrence of customers
- Increase the amount spent by customers by making available more options
- Reduce the cost by decreasing the fixed costs
- A medley of the above
Analysis of Margin of Safety
The margin of safety also shows a loss. The amount of the margin of safety when converted into units comes to be 845.
Analysis of Propositions
As suggested earlier, PHS is contemplating to start a new venture related to its present one. The management is of the opinion that the new venture will increase the customer base and also contribute towards the profit of the company. There are two proposals that the company is considering; proposal 1 and proposal 2. Proposal 1 aims at developing the present property by constructing a swimming pool, sauna and steam rooms. The proposed complex will cost £900,000. Proposal 2 includes the refurbishing of an existing outbuilding in order to convert it into a small meeting and conference centre and dormitory style accommodation. The cost for this proposal is expected to be £750,000. We have already done an appraisal of the two proposals using the accounting rate of return and the net present value methods.
Accounting Rate of Return
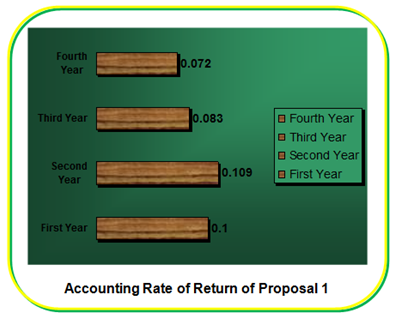
According to the accounting rate of return, Proposal 1 after a return of 10% in the first year shows an up-slide performance in the second year. The return in the second year is 10.90%. But after this, the rate is coming down continuously. In the third year the rate of return is 8.3% and that in the fourth year is 7.20%. It clearly indicates that the profits are coming down after the second year of performance. Following is graphical representation of the accounting rate of return of Proposal 1.
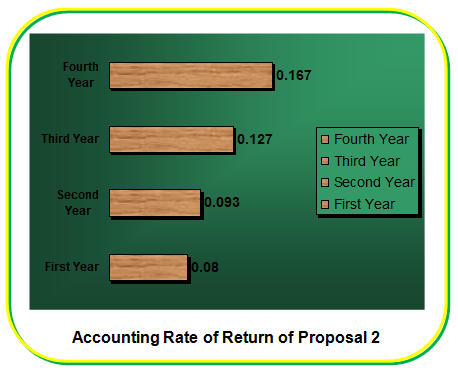
The accounting rate of return of Proposal 2 shows a stable upward movement in the rate of return. In the first year, the rate of return is 8%. Second year witnesses an increase and the rate of return is 9.3%. In the fourth year, the rate of return has gone up to 12.7% and in the fourth year, it is 16.7%. It is obvious that the growth is steady and the project seems to be feasible. Following is a graphical representation of the accounting rate of return of Proposal 2.
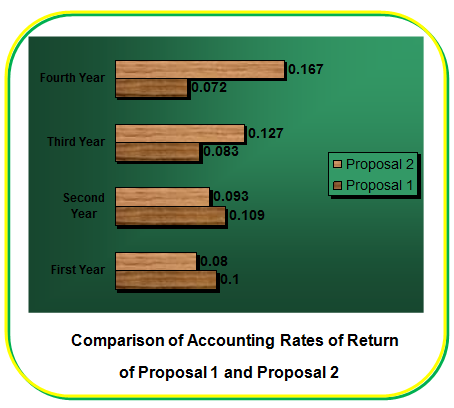
It is noticeable that even though the rate of return in Proposal 1 is higher in the first and second years, there is no stability. A comparison of both the proposals reveals that Proposal 2 is more apt and profitable than Proposal 1 in long run. Following is a graphical representation of both the proposals together.
The internal rate of return is compared to the company’s required rate of return. The required rate of return is the minimum rate of return that an investment project must yield to be acceptable. If the internal rate of return is equal to or greater than the required rate of return, then the project is acceptable. If it is less than the required rate of return then the project is rejected. (AccountingForManagement, n.d.).
Net Present Value
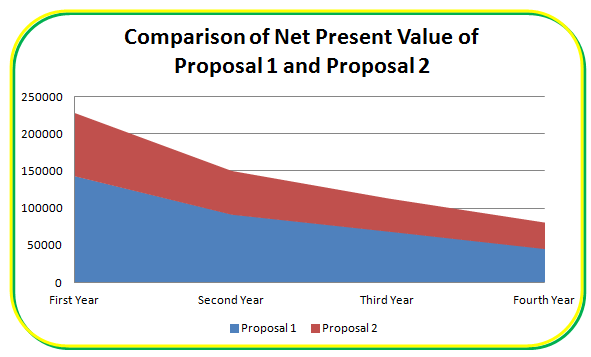
The net present value analysis of both the proposals also shows an inclination towards Proposal 2. Although there is a decrease in the net present value of both the proposals yet Proposal 2 has an upper edge. According to Harvard Business Essentials, “In solving for net present value and other time-value problems, it is important to know if the cash flows take place at the beginning or end of the period. The present value of a cash flow received in early January is worth more than the same amount received in late December of the same year.” (Harvard). Following is a graphical representation of both the proposals together.
References
AccountingExplained n.d., Accounting Rate of Return (ARR). Web.
AccountingForManagement n.d., Internal Rate of Return (IRR) Method in Capital Budgeting Decisions. Web.
Enotes n.d., Break-Even Point. 2012. Web.
Harvard 2002, Finance for Managers, Harvard Business Press, USA.
Moffatt, M n.d., Price Elasticity of Demand. 2012. Web.
Netmba n.d., Price Elasticity of Demand. 2012. Web.
NowLetsGetStarted n.d., Working out when you break even. 2012. Web.
Swathen 2011, Net Present Value Method. 2012. Web.