Abstract
This paper demonstrates the use of real financial data in financial analysis. The objective is to carry out a broad financial analysis for an actual company. It explores the various techniques and tools used for financial analysis. In the analysis, we use financial data for Nokia Corporation for five year period from 2006 to 2010. The study is based on a comparative analysis of historical data of the Corporation. The study concentrates on the statistical highlights of the Corporation, ratio analysis (ratios on profitability, liquidity, safety, and efficiency). In addition, percentages are used in the analysis to monitor changes over time. Graphs are also used to portray the trend of various variables in the study over the five years. Finally, the results are interpreted based on ideal situations, and recommendations are made based on the findings.
Introduction
Nokia Corporation is a global communication corporation incorporated in Finland. The corporation is divided into three segments that report financial results. These are the Devises & Services, NAVTEQ, and Nokia Siemens Networks segments. A vast proportion of sales is generated from Devises & Services segment. In 2010, the segment generated sales amounting to €29.134 million which is 68.6% of the total sales while NAVTEQ recorded 2.3% of total sales and Nokia Siemens generated 29.1% of sales. It further points out that, Nokia Corporation has markets all over the world with major markets being China, India, Germany, Russia, USA, Brazil, UK, Spain, Italy and Indonesia. China is the major market. In 2010, it recorded sales amounting to €7.149 million which is 16.8% of the total sales, followed by India at 7% of total sales and Germany at 4.6% of sales. There has been no change in the capital structure for the corporation over the period. The table below shows a summary of the financial performance of Nokia Corporation for five years from 2006 to 2010.
Summary of financial performance from 2006 to 2010
From table 1.0 above, it is evident that Nokia had an erratic performance over the five years. In the face of declining performance, the corporation did not report a loss in any of the years. Sales peaked in 2007 with a high of € 51,058 and went as low as €40,984 in 2008. Profit after tax for Nokia declined immensely in 2008 (€ 3,889) and 2009 (€260). In 2008, it reported a 42.4% decline in profit after tax and in 2009 it decline by 93.3%. Despite poor performance reported from 2008 to 2010, the Corporation paid a steady dividend with a range of 0.13 per share over the five years. However, earnings per share declined with poor performance. The graph below shows the trend of net sales and profit after tax for the five years.
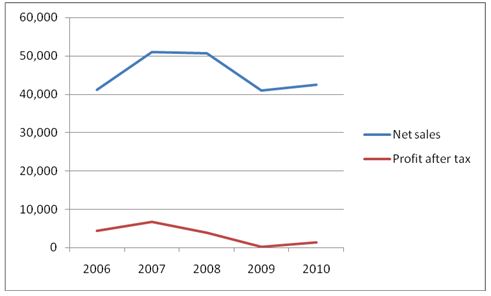
- The horizontal axis represents years.
- The vertical axis represents net sales and profit after tax.
Scope and objective of the study
The objective of this paper is to carry out a comprehensive financial analysis of the financial statements of Nokia Corporation and draw inferences on the financial status of the corporation. This analysis will cover five years from 2006 to 2010. At the end of the study, we will be able to conclusively locate the financial position of the Corporation in terms of profitability, liquidity, and efficiency. Further, we will make recommendations to potential investors based on the findings.
Literature review
Nokia Corporation prepare audited financial reports at the end of every quarter or mid of year or at the end of the year, as stipulated by law, for external use by different individuals or institutions such as shareholders, government, employees, community and creditors among others. Financial statements as they are providing the potential users with a narrow insight into the strengths and weaknesses of a business. This is for the reason that what is reported does not give an in-depth depiction of the business function over a period of time say five to ten years and it does not compare the performance of the business unit with others in the same industry. Such an in-depth view of a business is important as it would influence users’ decisions on whether to continue their relationship with an entity. In addition, it would give potential investors adequate information that can aid them in decision-making. This brings us to the concept of financial analysis.
Ratio analysis
Financial analysis is the process of evaluating businesses, projects, budgets and other finance-related entities to determine their suitability for investment. Basically, a comprehensive financial analysis is done on an institution’s financial statements to establish if an entity is stable, solvent, liquid, or profitable enough to be invested in. When looking at a specific company, the financial analyst will often focus on statement of income, statement of financial position, cash flow statement and statement of changes inequities. Ratio analysis is a key technique for financial analysis. One key area of financial analysis entails extrapolating the company’s past performance into an estimate of the company’s future performance. While inferring the current performance into the future, the time value of money is taken into consideration. This section will analyze the financial statements of Nokia Corporation using various techniques for the years 2006 to 2010.
Profitability ratios
Profitability is the ability of an entity to earn income and sustain growth in both the short term and long term. Some of the ratios which can be used to analyze profitability include gross profit margin, operating profit margin, net profit margin, the return on assets (ROA) ratio, and the return on equity (ROE) ratio. Profitability of Nokia can be analyzed by reviewing the income and expenditure accounts. Several ratios will be computed to give a good view of the corporation’s profitability from the year 2006 to 2010. The table below gives a comparative analysis of the profitability of Nokia over the five years.
Table of profitability ratios
From the above table, four ratios are computed to illustrate profitability of Nokia Corporation, that is, return on assets, return on equity, gross profit margin and net profit margin. All the ratios indicate an increase in profitability in 2006 and 2007 thereafter a decrease in profits from 2008 to 2009, in 2010 there was an increase in profits. The highest increase in profits was recorded in 2007 while the highest decrease was in 2009. Gross profit margin remained relatively stable, this implies that Nokia manage well its inventory, pricing, and production efficiency.
Net profit margin did not remain stable over the period, this may indicate that the Corporation could not generate adequate sales revenue to cover fixed costs so as maintain the profitability. Return on assets and return on equity also changed as net profit changed. The decline in performance over the two years was attributed to deteriorating global economic conditions, weaker consumer and corporate spending, constrained credit availability and currency market volatility. However, a new strategy was established, approved and disclosed. The strategy caused an increase in profit as noted in the results of 2010. The graph below shows the trend of change in profitability as indicated by the ratios over the five-year period.
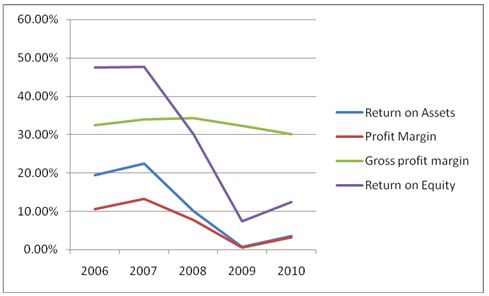
- The horizontal axis represents years
- The vertical axis represents the percentage change
Liquidity ratios
Analysis of liquidity is necessary as it establishes the ability of an organization to maintain positive cash flow while satisfying immediate obligations, that is, the availability of cash to pay the debt. The computation of these ratios will be based on the cash flows or liquid assets. A liquid asset can be defined as one that trades in an active market and thus can be quickly converted to cash at the going market price. The most common ratios used to analyze liquidity are current and quick ratios. The table below gives a summarized computation of the ratios.
Table of liquidity ratios
From the table above, the current ratio for Nokia ranges from 1.8 in 2006 to 1.2 in 2008. Similarly, the quick ratio range from 1.7 in 2006 to 1.1 in 2008. Further, the liquidity ratios for all the years are greater than one. We can deduce that Nokia has good liquidity ratios and is able to meet its current obligations if compared with ideal rates. The ideal current ratio is 2:1 while the quick ratio is 1:1, however this can change depending on the industry ratios.
Safety
Safety indicates a company’s vulnerability to risk, for example, the degree of protection provided for the business’ debt. Several ratios can be used to measure the safety of a business entity such as debt to equity. Computation of ratios for safety for Nokia is as below.
Table of safety ratios
The debt to equity ratio quantifies the relationship between the capital invested by owners and investors and the funds provided by creditors. The higher the ratio, the greater the risk to current or future creditors and a lower ratio means your client’s company is more financially stable and is probably in a better position to borrow now and in the future. An extremely low ratio may indicate that your client is too conservative and is not letting go of the business in realizing its potential. From the computations above, debt to equity ratio has been increasing over time from 0.8 in 2006 to 1.6 in 2010. This can be a sign of an increase in risk to current or future creditors. Further, it can result in volatile earnings as a result of the additional interest expense. This trend can be shown in the graph.
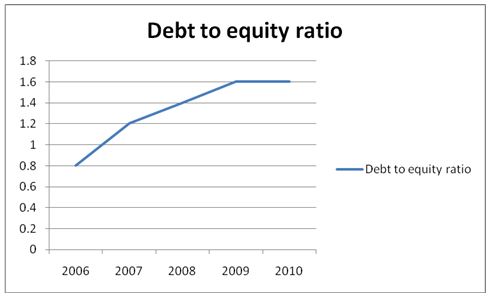
- The vertical axis represents a debt to equity ratio.
- The horizontal axis represents the years.
Efficiency
Efficiency ratios indicate how well a company is managing its resources, that is, how well a company employs its assets to generate sales and income. Further, it shows the level of activity of the corporation as indicated by the turnover ratios. Commonly used ratios are accounts receivable turnover, accounts payable turnover, days payable among others. Computations of these ratios in the context of Nokia are shown below.
Table of efficiency ratios
From the above table, the trend of accounts receivable turnover, accounts payable turnover and inventory turnover has been erratic. There has been both increase and decrease in the level of efficiency of Nokia with regard to accounts receivable, accounts payable and inventory therefore the future cannot be predicted with certainty. The graph below depicts the trend of efficiency in the years.
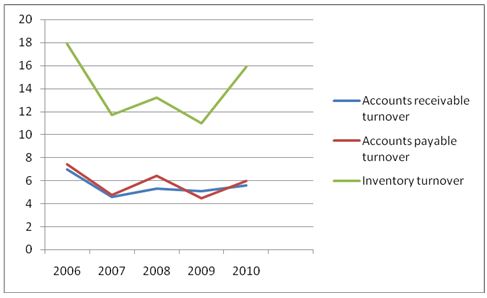
- The vertical axis represents ratios of accounts receivable, accounts payable and inventory turnover.
- The horizontal axis represents the years.
Sales to net worth and sales to total assets have declined over the years. The sales to net worth ratio indicate how many sales units are generated from each unit of investment while sales to total assets ratio indicate how efficiently the company generates sales on each unit of assets. It measures the ability of the company’s assets to generate sales. The above computations indicate that ability of Nokia to generate sales from net worth and assets has been declining over the years. This scenario can lower potential investors’ confidence inability of the Corporation to generate returns from their capital. The graph below shows the dilapidated trend of the two ratios.
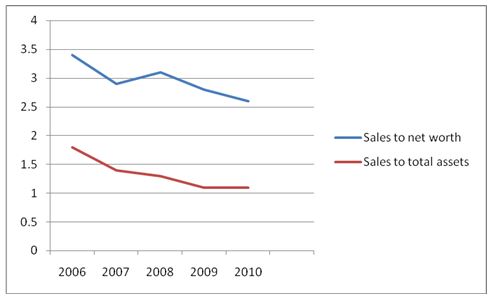
- The vertical axis represents ratios of sales to net worth and sales to total assets.
- The horizontal axis represents the years.
Methodology
In the study, data of Nokia Corporation for five year period from 2006 to 2010 was utilized. Financial analysis of the Corporation was based on the commonly used tools and techniques such as ratio analysis on profitability, liquidity, safety and liquidity, use of percentages, analysis of the capital structure and Du-Pont analysis among others. These tools and techniques were applied to the statement of income, statement of financial position and cash flow statement. The results were then explained and extrapolated to predict the future.
Conclusion and recommendation
Financial analysis can be complicated depending on the nature of the company. Comprehensive analysis of financial statements of companies that do not fall into a single industry tends to be more complex than those which fall in one single industry. Nokia falls in the very competitive telecommunication industry. From the above analysis, the profitability of Nokia has been declining over the years. However, turn round strategies were put in place and the Corporation recorded an increase in profits in 2010. Despite the poor performance, Nokia paid steady dividend while earnings per share declined. The Corporation was able to meet its immediate obligations in all the years. Further, creditors’ confidence may possibly be lowered due to the declining trend in the debt-equity ratio. There was an inconsistent trend inefficiency of the corporation with sales to total assets and sales to net worth declining over the years.
The current state of affairs of the Corporation cannot be extrapolated into the future with certainty because of the inconsistencies noted. Further, the situation may not guarantee potential investors a high rate of return on their investments within a short time. An investor should consider monitoring further the trend of financial performance of Nokia for a few more years to ascertain if the current trend will completely reverse before injecting capital.
Reference List
Adams, D. (2006) Management accounting for the hospitality, tourism and leisure industries: a strategic approach, 2nd ed., Thomson.
Atrill, P. and McLaney, E. (2006) Accounting and finance for non-specialists, Financial Times: Prentice Hall.
Bridge, J and Moutinho, L. (2000) Strategic management in tourism, London: CABI Publishing.
Butterworth-Heinemann Byrnes. (2009) Management and the Arts, 4th ed., Focal Press.
Collis, J. and Hussey, R. (2007) Business Accounting: An Introduction to Financial and Management Accounting, Basingstoke: Palgrave Macmillan.
David, E. (2003) Financial analysis and decision making: Tools and techniques to solve, United States: McGraw-Hill books.
Erricos, J. and Cristian, G. (2007) Optimisation, econometric and financial analysis, London: Springer-Verlag.
Eugene, F. and Michael, C. (2009) Financial management theory and practice, London: Prince Hall.
Eugene, F. and Joel, F. (2009) Fundamentals of financial management 12th ed.,USA: South-Western Cengage Learning.
Fahey, L. (1999). Competitors, New York: John Wiley & Sons.
Francis, J. C. (2010) Corporate financial analysis with microsoft excel, New York: McGraw-Hill Companies, Inc.
Helfert, E. (2001) Financial analysis, tools and techniques: Assessment of business performance, New York: McGraw-Hill books.
Jeffry, R. H. (2004) Accounting dimistified, New York: American Management association.
Longenecker, G. J., Petty J W., Palich E. L. and Moore W. C. (2009) Small Business Management: Launching and Growing Entrepreneurial Ventures.USA: Cengage Learning.
Nokia Corporation Limited. (2011) Investors and financials, latest financials. Web.
Nokia Corporation Limited. (2011) Our company,the nokia story. Web.
Siddidui,S. (2005) Managerial economics and financial analysis, New Delhi: New age international (P) limited.
Steven, M. B. (2007) Financial Analysis a controllers guide: Financial analysis, 2nd ed., New Jersey: John Wiley & sons.
Thomas, F. and Lydia, L. (2003) Essentials of financial analysis, New Jersey: John Wiley & Sons.
University of Missouri. (2011) Financial ratios. Web.
Zahra, S. A. and George, G. (2002). International Entrepreneurship: The current status of the Field and Future Research Agenda in Strategic Entrepreneurship creating a new mindset. Oxford Uk: Blackwell Publishing.