Ford Motor Company is an automobile manufacturer based in the US with subsidiary plants dispersed in other parts of the world. The company was founded by Henry Ford credited for the mass production of automobiles before the turn of the century. It was incorporated in 1948 and converted to a limited liability company in 2007 (“Ford Credit Investor Center: Company Reports” 1).
Ford Motor Company has since grown from its inception into a modern automobile manufacturer. To gain an understanding of the operations of any business, several tools and techniques can be used. Trend analysis is one such technique that can be used to assess the progress of a business venture over a defined period. The analysis could simply be calculated based on annual gross profit. As such and in general, an increase in profit illustrates a growth trend. The financial analysis here is based on the finances of Ford Motor Company as a company quoted on the stock exchange.
The table (Table 1) below shows the net sales and income for Ford Motor Company with the year 2005 as the base year.
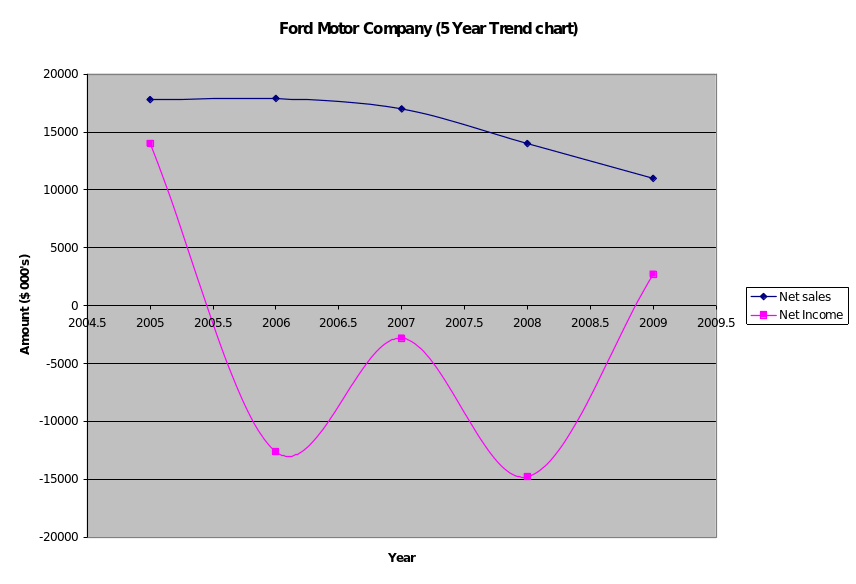
The graph below shows the trend for the years 2005 to 2009:

To further gain financial understanding, several financial ratios can be used. This write-up is going to use some of these ratios to assess the financial state of Ford Motor Company over the period from 2005 to 2009.
The gross profit margin is a ratio calculated using the gross profit against the sales as summarized in the formula here below:
- Gross profit margin = Gross profit / Sales
A high ratio indicates a good control policy while a low ratio indicates high production costs, over investments, or inefficient operations.
Making a comparison of the profit margin for the years 2008 and 2009 we have the following:
- 2008: Profit margin = 9220/14000 = 0.658
- 2009: Profit margin = 12104/11000 = 1.1
From the figures above, we can conclude that in the year 2009, Ford Motor Company had a better control policy with reduced inefficient operations.
The return on assets ratio (ROA) = Net profits before tax and interest / net total asset- current and fixed.
Making a comparison of the return on assets for the years 2008 and 2009, we have the following:
- 2008: ROA = 9220/150127 = 0.06
- 2009: ROA = 12104/ 117344 = 0.01
A reducing ROA in the subsequent year 2009 indicates that Ford Motor Company is improving in profitability.
The return on total shareholders equity (ROT Sh) = Net profit after tax/ Ordinary + preference + (capital + revenue)
Making a comparison of the ROT Sh for the years 2008 and 2009, we have the following:
- 2008: ROT Sh = 7898/10566=0.74
- 2009: ROT Sh = 9164/ 10980 = 0.83
The year 2009 indicates a higher ROT Sh indicating a more profitable period than 2008
The return on equity (ROE) is also another ratio that can be used to determine profitability given by the following formula
ROE= Net profits after tax/ ordinary share capital + revenue and capital reserves
Making a comparison of the ROE for the years 2008 and 2009, we have the following:
- 2008: ROE = 10566/5417 = 1.95
- 2009: ROE = 10980/5831 = 1.88
The business owners are likely to receive less in 2009 than in the previous year.
Asset turnover = sales / total assets
Making a comparison of the Asset turnover for the years 2008 and 2009, we have the following:
- 2008: = 199/150127 = 0.001
- 2009: = 25/ 117344 = 0.0002
The debt to asset ratio us to understand the ability of the company to meet its financial obligations. This ratio is derived using the total debts over total assets.
- 2009: Asset to debt ratio = 1.17
- 2008: Asset to debt ratio = 1.04
Ford’s asset to debt ratio has increased from 1.04 in 2008 to 1.17 in 2009. This shows a probability of low solvency.
Ford Motor Company has been going through a difficult period as can be inferred from their financial statements. However, a turnaround from the losses in 2008 to profit in 2009 indicates that the company has potential and as it continues with its restructuring program, the company is likely to increase profitability in the subsequent years. An analysis of the 2010 financial statement will reveal that Ford Motor Company made a tremendous growth reflected in their profit with increased sales from 10500 units in 2009 to 11775 units in 2010. During the same period, the company also recorded an increase in net income from 2.7 billion dollars in 2009 to 6.6 billion dollars in 2010 (“Ford Credit Investor Center: Company Reports” 1).
Based on this brief analysis, it is valid to conclude that Ford Motor Company seems out of the financial difficulties that have been highlighted from the year 2006. The growth of the company will nevertheless depend on improved global economic trends.
Work Cited
“Ford Credit Investor Center: Company Reports.” FordCredit.com. FordCredit, 2011. Web.
