Brief History of the Company
Wal-Mart’s first store was opened in 1962 in Rogers, Arkansas (“Wal-Mart’s 2012 Annual Report” 7). Profitability of the store led to the establishment of other stores. The stores’ services have been elaborated giving its customers excellent shopping experiences. The stores’ focus on customer satisfaction through offering superior services has been vital to the success of the store. The stores’ good performance made it go public. In 1970, the store raised capital to finance major expansion plans. The stores’ pricing strategy (low prices) also contributed to the success of the enterprise.
Employees are motivated to work for the enterprise by its continuous changes (“Wal-Mart’s 2013 Annual Report” 16). The stores aim at delivering seamless shopping experiences through various channels. Personalized and relevant services improve their customer relations, which is an important sales driver (“Wal-Mart’s 2014 Annual Report” 23). Treating the customer as the king is a tradition of the company that ensures customers do not receive poor services. Good treatment maintains the company’s clientele. The firm’s customer-centric model of conducting business was initiated by the founder of the business, Roger Watson. The employment of modern technology has improved the stores’ interaction with customers
The giant retail chain has 6,100 retail units operating in 26 countries. The company employs over 2.2 million people all over the world and serves above 200 million customers weekly in all the 6,100 retail outlets.
The Company’s Industry and Major Competitors
Wal-Mart operates in the retail industry, which has several key players. Wal-Mart’s main competitors are general merchandise retailers, supermarkets and warehouse clubs. Most retail traders offer discounts with the aim of attracting and retaining customers. The fast-paced, continuous growth of the retail industry has created stiff competition among retailers. Competition exists mainly in areas such as the location of retail outlets, the prices charged, the environment, store size, layout, technology and innovation, and overall image (Shapiro and Balbirer 145).
The retail market is dictated by the ability of a retailer to buy supplies in large scale to get fair prices (economies of scale). Large retailers such as Wal-Mart can integrate various activities such as shipping, purchasing, manufacturing and advertising. The integration of activities enables a retailer to charge low prices due to a reduction in the cost of hiring such services.
Wal-Mart’s main competitors on general merchandise are Target and Kmart. These three are big retailers though Wal-Mart is the largest. Customers prefer Wal-Mart because it has a variety of items to select from compared to the other two sellers. The store can rise above the competition on general merchandise because it offers lower prices, a wider selection of goods and quality products.
On the warehouse section, Wal-Mart gets stiff competition from Costco, which has fewer warehouses but attains greater sales revenues. Costco beats Wal-Mart due to its innovativeness and a wider variety of goods. In the grocery business, Wal-Mart is a threat to a majority of large and small supermarkets such as Kroger, Albertson’s and Safeway. Due to its size, Wal-Mart can use economies of scale to lower its prices and still make profits. Its large size gives it the power to dictate prices even for the suppliers because it is the main consumer of their supplies.
According to the five force model, Wal-Mart is a multinational retail outlet, which gives it strength in the face of competition. It has the largest market share due to low prices brought about by economies of scale. The firm is not threatened by substitutes because it stocks the largest variety of goods. Vertical integration of a number of logistics operation and the bargaining power due to large scale consumption of supplies allows it to outcompete the majority of retail outlets (Higgins 237).
Comparison of Financial Data
The information used for comparison is obtained from financial statements for the years 2012, 2013 and 2014. The financial statements used include the cash flow statements, income statements and balance sheets.
Cash Flow Statements
Cash flow statements indicate major activities involving cash in a particular year. They show the details of cash expenditure and help in the analysis of cash items to determine weaknesses in the management of cash.
The pattern shows growth between 2012 and 2013 though cash from financing is negative. The growth between 2013 and 2014 is negative because cash from the operations is used in purchases of stock or paying dividends.
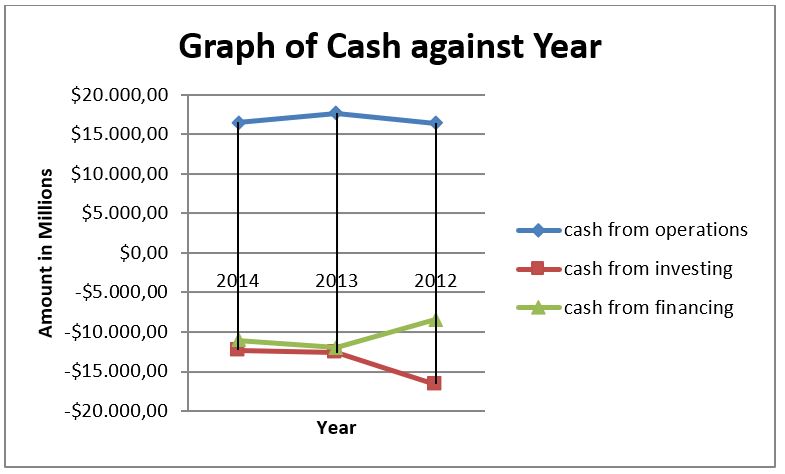
The above graph indicates that Wal-Mart has cash received from its operations, and has spending on financing and investing where financing takes the smaller share of the finances. The cash from financing decreases from 2012 to 2014 while cash from investments (major cash source) increases as more investments are made.
Statement of Comprehensive Income
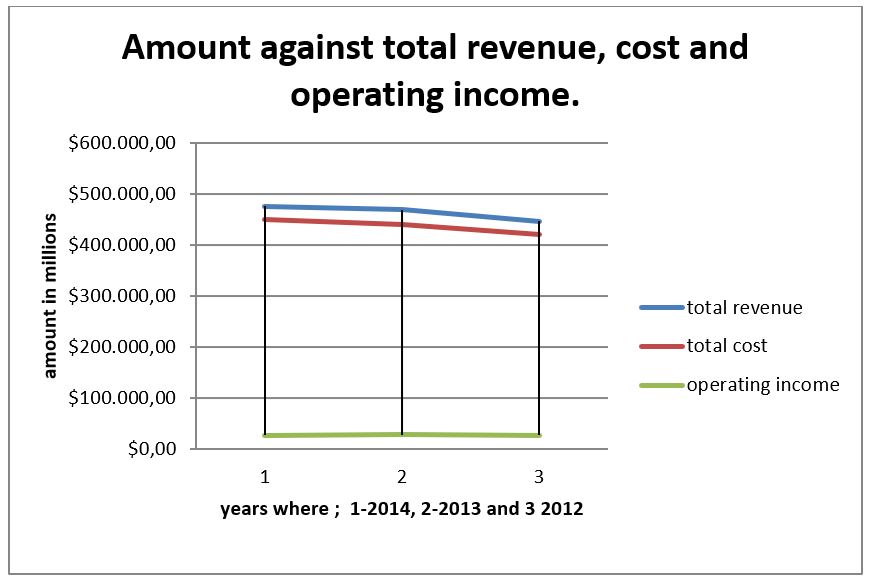
This statement provides a summary of the trading activities and the expenses incurred. It is useful in the determination of the gross profit/loss and the net profit /loss. It is useful in the computation of financial ratios that indicate the margin to which a venture gets from its trading activities.
The operating income in 2013 is less than in 2012. The income rises then falls again in 2014 due to an increase in operating expenses as the revenue increases.
Balance Sheet
A balance sheet is useful in ascertaining a company’s net worth because it summarizes the total assets and liabilities. The information in the balance sheet is useful to management and investors because it indicates the financial stability of a venture.
The balance sheet summary extract indicates that additional assets were added to the business. The current liabilities decreased but the long term liabilities increased. The total equity also decreased.
Financial Analysis of the Company
Financial analysis uses the company’s financial statements for the years 2012, 2013 and 2014.
Profitability Ratios
These ratios indicate how cost-effectiveness a business in the utilization of its resources.
Net profit margin=net income/net sales*100
From the table, the operating margin has continuously declined from 2012 to 2014. The decline can be attributed to an increase in efficiency. The margin of a dollar that is spent on non-related sales activities is eliminated.
Asset Utilization Ratios
This ratio assesses the effectiveness of a company in using its assets to generate income.
Return on assets= net income /assets*100
The amount of revenue generated by every invested dollar is 0.99 in 2013 and 0.98 in 2014.
Return on equity= net income/shareholder investment*100
The company generates a dime in profits for every dollar that has been invested.
Return on capital employed (ROCE) = earnings before interest and tax (EBTI)/capital employed*100
The return on capital employed in 2013 is less than in 2014 indicating that the return was increased.
Liquidity Ratios
A return on equity of 2.4% shows that the company has a low level of liquidity.
Liquidity ratio =current assets/current liabilities
The liquidity ratio indicates that the short term debts of the company are not fully covered by the current assets.
Debt Utilization Ratios
Debt ratio=total liabilities /total assets
The ratio is less risky because the assets of the business are more than its debts (Harrington 215). The percentage owned by creditors in 2014 is 60.27, which is an increase from 59.76 in 2013. Such a trend should, however, not continue as it may cause the business to fall into debt.
Strategic Direction of the Company
The Company’s Plans to Achieve its Short and Long Term Goals
The company needs to avoid cash financing in the short term and use cash investment in the long term. It should strike a balance between offering affordable prices and ensuring maximum returns on every dollar invested. The ratio analysis points out weaknesses such as low returns on equity, which indicates that the firm needs to improve its use of assets.
Recommendations for Future Investment
The company should ensure that its revenues increase as the costs reduce. The current liabilities are higher than the current assets, which is not good in the long term. This trend needs to be reversed to allow the company to meet the current debts from its current assets.
The economies of scale ought to be checked to avoid operating on a large scale and still face competition from wholesalers due to lack of innovation. The business should align itself with the best financial management practices such operating on lean budgets. The management should consider restructuring its capital to maximize asset utilization.
References
Harrington, Diana R. Corporate Financial Analysis in a Global Environment. 7th ed. 2003. Cincinnati: South-Western College Publishing. Print.
Higgins, Robert C. Analysis for Financial Management. 9th ed. 2009. New York, McGraw-Hill/Irwin. Print.
Shapiro, Alan C, and Balbirer, Sheldon, D. Modern Corporate Finance: A Multidisciplinary Approach to Value Creation, Upper Saddle River, NJ: Prentice Hall, 2000. Print.
Wal-Mart’s. 2012 Annual Report. 2012. Web.
Wal-Mart’s. 2013 Annual Report. 2013. Web.
Wal-Mart’s. 2014 Annual Report. 2014 Web.