Executive summary
Woolworth Limited and WESFARMERS Limited are two companies that deal in business from different areas. They have operated business for a long period thus gaining better experience in business spheres. They show great differences in their business operation strategies, which are quite appealing to study. The objective of this paper is to guide the group through the business operations professionally through a closer view on the financial records of 2010and 2011. This will enable all the prospective investors to make sound decisions on which firm to invest in.
Introduction
Wesfarmers started in 1914 June in Australia. During its early stages, it was known Westralian Farmers Co-operative that involved in providing services and market of goods. About seventy years after its formation, it had farmers as its major shareholders thus enabling it to feature on the list of the Australian Security Exchange in 1984 in the months of November. Since its first listing, Wesfarmers has always featured in the topmost groups of companies that perform well. This is when it is considered in terms of shareholders’ total returns (Kruger, 2011). Currently Wesfarmers deal with a variety of services that include insurance, hardware retailing, mining, fertilizers and chemicals, industrial and security products and energy. It entered into its most glorious moments in 2007 when it included Coles Group Limited in its operations. This made it increase both its employees and shareholders.
Woolworth has its roots related to an England great man known as Frank Woolworth. This company started when Frank set up a shop in Pennsylvania. He had a great love for England, and he had faith that his ten and five cents formula could work properly across the Atlantic. The formula means that everything could be sold at five-cent or ten cents. In his remarks, he said, “I believe that a good penny and sixpence store, run by a live Yankee, would be a sensation here.” WOW deals with supermarket activities like liquor and food, which forms the largest percentage. It also deals with BIGW, electronics, Tandy and Powerhouse, petrol and hotels located in New Zealand. This paper aims and comparing the two companies to check on their stability in business using financial records of the year 2010 and 2011.
Discussion
Gross profit and net profit margin
Gross profit margin are a financial metric that is used in assessing a company’s financial status by revealing the quantity of cash left from revenue after getting the cost of goods that are sold (Smith, 2004). It serves as a source for paying future additional expenses. Net profit margin, on the other hand, is a ratio of profit computed either as net income divided by revenues or net gains by sales.
High-profit margins may be indicators of more profitable companies.
Profitability ratios indicate the firm’s general performance and efficiency. Profit ratios can be separated into two major parts, returns and margins. Ratios, which show margins, signify the company’s ability to change sales of Dollars into profits at different steps of measurement. Ratios, which show returns, indicate the company’s overall efficiency to generate returns to shareholders. This part specifically deals with profitability then will be followed by efficiency (Kruger C. 2011).
For instance, Woolworth had 25.73% in 2010 while it was able to get 25.78% in 2011. This is an increment of 0.5% on its gross profit. It was also able to get 5.96% in 2010 and 6.05% in 2011. This indicates that the firm was able to record an increment of 0.9% on its net profit.
On the other hand, Wesfarmers had a gross profit of 30.99% in 2010 while in 2011, they managed to get a 30.96% gross profit margin. According to this data, the company recorded a negative gross profit margin of 0.03%. The firm was able to make a net profit margin of 5.76% in 2010 and then 6.11% in 2011. According to the records, the firm recorded a positive increment of 0.35%.
The two companies have great differences In relation to profitability. For the gross profit, Woolworth Company recorded an increase of 0.5% whereas Wesfarmers recorded a decrease of 0.03percentage on its gross profit (Sharp, 2008). The difference, in this case, can be caused by several factors. First, it is possible that the Wesfarmers are reducing the prices of goods that they sell. This in turn reduces their gross profit in general. It is also possible that Wesfarmers has increased the cost of goods sold thus reducing the rate of gross profit. The Woolworths Company has recorded an increase in gross profit at 0.5%.
Woolworths Company recorded an increase of 0.9% on its net profit while the Wesfarmers recorded an increase of 0.35%. In these cases, all the firms gained in their net profits although Woolworths has a greater profit rate of 0.55%.
According to the analysis, the Woolworths Company is more vibrant than Wesfarmers in terms of profit-making. They have better strategies to appeal to customers to buy their products thus standing at a better chance than their counterparts do. In this context, Wesfarmers Limited has to come up strongly and look at ways of reducing the cost of goods that they sell and maintaining their prices while appealing for more customers to buy from them for better competition to exist between it and Woolworths (Hall, 2009). This can be an outer view of the company but, real investors look at other specific factors before deciding on which security company to invest in.
Returns on assets
Returns on assets are pointers of how firms are relative to their total assets. ROA explains how the management is efficient to use assets in generating income. It is computed by taking annual income then dividing it by its overall assets. It is normally expressed as a percentage. Some people call it to return on investment (Ryan, 2007). For Woolworths limited, it had 16.68% in 2010 and 15.54% in 2011. This generates a decline of 1.14%. Wesfarmers had 7.31% in 2010 and 7.94 in 2011, making a gain of 0.6%. According to the comparison above, it is the reality that Woolworths has a greater number of ROA than Wesfarmers (Sharp, 2008). This indicates that Woolworth’s management is aggressive in investing the shareholder’s cash to gain more profit than Wesfarmers. Although it dropped in 2011, it is still higher than Wesfarmers, which increase upto7.94percentage.
Return on Equity
Return on equity is the quantity of net income that comes as a percentage of shareholders’ equity. It determines a firm’s profitability by providing information on the amount of profit gained using the shareholder’s money (Smith, 2004). The other name for return on equity is (RONW) “Return on net worth” and expressed in a percentage form. For instance, Woolworths had 26.07% in 2010 while in 2011 they had 27.28%. This enabled them to make a gain of 1.21%. On the other side, Wesfarmers had 6.34% in 2010 then moved to 7.59% in 2011 (Kruger, 2011). It enabled them to get an increase of 1.21%. Although all the firms have realized positive changes, Woolworth’s rate of turnover is higher than that of Wesfarmers.
Asset turnover
This is the amount of all sales generated per dollar worth of assets. It is computed by dividing the number of sales in dollars by the assets in dollars. It is also called the ratio of asset turnover (Ryan, 2007). It measures the ability of a company to use its own assets to generate revenue or sales. When the number of asset turnover is high, the company can be better placed. In this case, Woolworth has 2.80 in 2010 and 2.75 in 2011 making a difference of 0.23downwards. On the other side, Wesfarmers has 1.27times in 2010 while it had 1.30times in 2011.
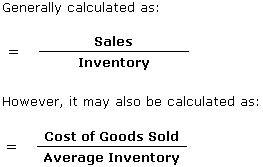
Inventory analysis
Inventory turnover indicates the number of times that a company has sold its goods and replaced them within a given period. The number of days can be computed by the inventory turnover to come up with the number of days it takes to sell the goods. When the inventory turnover is high, it indicates that the business is undergoing risk status since it may represent a zero return (Smith, 2004). It is also dangerous in case prices of commodities start to depreciate. In this case, Woolworths limited has inventory turnover as 33days in 2010 while in 2011, it has 34 days. On the other side, Wesfarmers has 49 days in 2010 while in 2011 it has 50 days. In this context, Wesfarmers has a higher inventory turnover compared to Woolworths. It is dangerous for the Wesfarmers because it seems the stock moves at a very lower rate. The management has to move fast to ensure that their prices do not scare away customers.
The ratio for account receivables analysis
This accounting measure is used for quantifying the firm’s effectiveness to extend credits to customers. It also considers the ability of the firm to collect its debts. A ratio measures the effectiveness of the firm to use its own assets. A high receivable ratio indicates that the firm relies on cash selling or in other words, the firm’s management is effective in its debt collection. For the case of this study, Woolworth has 1.5 days in 2010 while the same company has 2 days in 2011. The Wesfarmers have ten days in 2010 and eleven days in 2011. This means that the management in Woolworth is effective in its debt collection since it has to pay its creditors in time (Ryan, 2007). The Wesfarmers are using their own resources therefore; they do not have a lot of problems with the period within which debts are paid. This may sound also like the inability to collect debts in the case of Wesfarmers.
Debt equity ratio
This measure shows how a company has been supporting its activities through debts. High debt/ equity rate shows that affirm has supported its activities through debts thus increasing the volume of sales thus getting more returns (Hall, 2009). It is important to note that high debit/credit may be dangerous since the cost of repaying the debts may be too much for the company to pay. For instance, Woolworth has a debt/equity ratio of 136.48% in 2010 then 168.86% in 2011. Which brings a positive deviation of 32.38%. The Wesfarmers has 58.89% in 2010 and 61.14% in 2011 (Smith, 2004). This makes it gain a positive deviation of 2.25 %. According to the statistics, Woolworth stands a chance of getting many problems to repay their debts through which they have extensively used to support their business activities. The management must discuss how to reduce the dependence on debts to run their business. This is an indicator that Woolworth is quite unstable financially than Wesfarmers.
Payable Turnover Ratio
This is an indicator of how the firm can pay its creditors within a period. The other name for payables turnover is creditor’s turnover ratio. A shorter time limit can be provided by the creditor for a firm to make payments. Therefore, a firm with a high payable turnover can easily enjoy credit facilities than a firm with a low payable rate. High payable turnover may indicate that the business has better liquidity services. A point that should be understood with great cautiousness. For instance, Woolworth has a payable turnover of forty days in 2010 and then the same during the year 2011 (Kruger, 2011). Wesfarmers has a slightly longer period of forty-nine days in 2010 and then fifty days in the year 2011. As mentioned, Woolworth takes fewer days to repay all its creditors while Wesfarmers takes longer to repay its creditors.
Quick Ratio
This is an indicator of a firm’s short-term liquidity. It measures the ability of a company to meet its short-term duties using its liquid facilities. It is also referred to as quick asset ratio or acid-test- ratio. The quick ratio is more important than the current ratio. This is because sometimes it is difficult to change the assets into cash. This ratio excludes all the inventories due to the difficulty in changing them into cash. If a company has a high quick ratio then, it stands a better chance of meeting its short-term duties. Some companies may not get a clear picture of a quick ratio thus making mistakes. In this case, Woolworth had a quick ratio of 0.21 in 2010 then, in 2011 it had 0.32. The Wesfarmers have 0.64 in 2010 and has 0.59 in 2011 (Sharp, 2008). It is true from the records that Wesfarmers has a greater ability to pay its short-term obligation than Woolworth does. This is because Woolworth is using more credit facilities than its own working capital.
Current ratio
Current ratio is a liquidity ratio, which measures the capacity of a company to pay back its short-term duties. It has several names in business, for example, Cash Asset Ratio, liquidity ratio or cash ratio. This ratio resembles the Acid Test Ratio but the only difference is that Acid Test does not include prepaid assets and inventories, which can easily change into cash. The current ratio can provide a sense of a company’s efficiency or the capability to change its goods into cash (Ryan, 2007). Woolworth had 0.73 in 2010 while it increased the following year up to 0.8 Kruger C. 2011. On the other hand, Wesfarmers had 12.23 during 2010 and 17.17 in the year 2011. This indicates that Wesfarmers has a greater ability to change its goods into cash than Woolworth does.
Times interest earned
Times Interest Earned is a metric measure that determines the ability of a company to meet its own debt obligations. It is computed by taking a firm’s gains before taxes and interest then dividing by the sum of interest payable on contractual debts and bonds. It is quoted as a ratio and shows how many times a firm is able to pay its interest rates. A company that fails to meet its obligations goes into bankruptcy. It is also known as fixed Charged Coverage or Interest Coverage Ratio. A high rate means that a company may be paying debts using its gains thus limiting it from investing in other activities. Woolworth had 12.92 in 2010 while in 2011 it had 10.92. Wesfarmers had 4.39 in 2010 while in 2011 they had 6.14 (Smith, 2004). This indicates that Woolworth has greater problems handling its short-term obligations than Wesfarmers.
Limitations
Woolworth Company has several limitations. it is depending on the creditors to run business activities. It is very dangerous to depend on creditors since they can disappoint in one way or the other. On the other hand, Wesfarmers has a problem with debt collection. They give their clients a longer period thus denying the company full enjoyment of the operating profit.
Recommendations
The Woolworth Limited is more vibrant in profit-making and debt collection. This is quite understandable due to the reason that the firm is using more debts to run its business operations (Vanda, 2008). This means that the company cannot meet its short-term obligations. This makes it a dangerous firm to invest in since it can easily fail in daily operations when the creditors fail to support it.
On the other hand, Wesfarmers is a cool firm that deals keenly with its clients although it has slight problems. The period for debt collection for Wesfarmers is just too long. This denies the firm to enjoy its business status. Wesfarmers is a steady company that can easily meet all its long-term and short-term obligations. This is because the firm depends mostly on its own resources to run its daily activities.
List of References
Hall, J. (2009). Woolworths’ shareholder slams chain closure. London: The Daily Telegraph. Journal of Business & Economic Statistics 20 (10), 130
Kruger, C. (2011), Blow for Woolies as Tata ends Indian venture The Sydney Morning Herald. American Economic Review 9 (2), pp. 402–30
Ryan, P. (2007). Coles board recommends a $22b takeover offer, ABC News online. Journal of Business & Economic Statistics 21 (6), pp. 6-10
Sharp, A. (2008). Woolies shelves Safeway brand, The Age, Melbourne. Journal of Economics 22 (1), 147
Smith, K. (2004). A bunch of pirates is the story of a farmer co-operative, Wesfarmers Perth. New York: Westralian Farmers Co-operative.
Vanda, C. (2008). Check out Woolies’ lead on Coles Sydney Morning Herald. Journal of the European Economic Association 1 (6), 1346–66.
Appendices
Calculation formulas
Number 1:
![]()
Number 2:
![]()
Number 3:
return on assets![]()

![]()
Debt equity ratio![]()
Debt/equity ratio![]()
![]()
![]()
![]()
MAA103/MAAP 103Assignment Mark sheet – trimester 3, 2011