The Analysis of Apple Company

Summary

The initial name of Apple, Inc. was Apple Computer and it was created on April 1, 1976, by Steve Jobs and Steve Wozniak. The company was incorporated on January 3, 1977, in Cupertino, California. Initially, the company was engaged in the manufacture of personal computers. In the year 1985, Steve Jobs was ousted from the company. In the year 1996, Apple bought Steve Job’s company NeXT and made him the Chief Executive Officer. Apple introduced the iPod music player in 2001 and within the last few years, more products were added like iPhone, iPod Touch and iPad. Today Apple is of the largest technology firms in the world, with annual revenues of more than $60 billion.

Members of Apple’s Board of Directors: (Source: Apple, Inc.)

  • Arthur D. Levinson, Ph.D. – Chairman and Chief Executive Officer, Genentech, Inc.
  • William V. Campbell – Chairman and former CEO, Intuit, Inc.
  • Tim Cook – CEO, Apple
  • Millard S. Drexler – Chairman and Chief Executive Officer, J. Crew
  • Albert Gore, Jr. – Former Vice President of the United States
  • Robert A. Iger – President and Chief Executive Officer, The Walt Disney Company
  • Andrea Jung – Chairman and Chief Executive Officer, Avon Products, Inc.
  • Ronald D. Sugar, Ph.D. – Former Chairman and CEO, Northrop Grumman Corporation

Apple’s Organizational Structure: (Source: Apple, Inc.)

  • Tim Cook – CEO
  • Eddy Cue – Senior Vice President, Internet Software and Services
  • Scott Forstall – Senior Vice President, iOS Software
  • Jonathan Ive – Senior Vice President, Industrial Design
  • Bob Mansfield – Senior Vice President, Mac Hardware Engineering
  • Peter Oppenheimer – Senior Vice President, Chief Financial Officer
  • Phil Schiller – Senior Vice President, Worldwide Product Marketing
  • Bruce Sewell – Senior Vice President and General Counsel
  • Jeff Williams – Senior Vice President, Operations
  • Apple’s independent auditors are Ernst & Young LLP.

Apple, Inc. (AAPL) Annual Balance Sheet

Period Ending FY2010 FY2009 FY2008 FY2007 FY2006
Assets
Cash and Short term Investments 25.73 B 23.46 B 22.23 B 15.39 B 10.11 B
Net Receivables 9.92 B 5.06 B 4.70 B 4.03 B 2.84 B
Total Inventories 1.05 B 455.00 M 509.00 M 346.00 M 270.00 M
Progress Payments & Others 0.00 0.00 0.00 0.00 0.00
Prepaid Expenses 157.00 M 309.00 M 475.00 M 417.00 M 208.00 M
Other Current Assets 4.82 B 8.09 B 2.09 B 1.78 B 1.08 B
Current Assets Total 41.68 B 31.56 B 30.01 B 21.96 B 14.51 B
Long Term Receivables 0.00 0.00 0.00 0.00 0.00
Investment in Consolidated Subsidiaries 25.39 B 10.53 B 2.38 B 0.00 0.00
Other Investments 0.00 0.00 0.00 0.00 0.00
Property, Plant & Equipment Net 4.377 B 2.95 B 2.46 B 1.83 B 1.28 B
Property, Plant & Equipment Gross 7.23 B 4.67 B 3.75 B 2.84 B 2.08 B
Accumulated Depreciation 2.47 B 1.71 B 1.29 B 1.301 B 794.00 M
Other Assets 3.35 B 12.99 B 1.23 B 1.47 B 1.42 B
Deferred Charges 799.00 M 844.00 M 208.00 M 625.00 M 1.04 B
Tangible Other Assets 1.46 B 898.00 M 208.00 M 625.00 M 1.04 B
Intangible Other Assets 1.08 B 453.00 M 559.00 M 420.00 M 198.00 M
Total Assets 75.18 B 47.50 B 36.07 B 25.26 B 17.20 B
Liabilities
Short Term Debt & Current Portion of Long Term Debt 0.00 0.00 0.00 0.00 0.00
Accrued Payroll 436.00 M 357.00 M 320.00 M 254.00 M 221.00 M
Income Taxes Payable 210.00 M 430.00 M 506.00 M 488.00 M 388.00 M
Dividends Payable 0.00 0.00 0.00 0.00 0.00
Other Current Liabilities 8.06 B 5.12 B 5.02 B 3.59 B 2.47 B
Current Liabilities Total 20.72 B 11.51 B 11.36 B 9.30 B 6.47 B
Long Term Debt 0.00 0.00 0.00 0.00 0.00
Provision for Risks & changes 0.00 0.00 0.00 0.00 0.00
Deferred Taxes 4.30 B 0.00 895.00 M 531.00 M 381.00 M
Deferred Income 1.14 B 853.00 M 768.00 M 830.00 M 355.00 M
Deferred Tax Liability in Untaxed Reserves —– —– —– —– —–
Other Liabilities 1.23 B 4.36 B 746.00 M 67.00 M 14.00 M
Total Liabilities 27.39 B 15.86 B 13.77 B 10.73 B 7.22 B
Shareholders’ Equity
Non-Equity Reserves 0.00 0.00 0.00 0.00 0.00
Minority Interest 0.00 0.00 0.00 0.00 0.00
Preferred Stock 0.00 0.00 0.00 0.00 0.00
Common Equity 47.79 B 31.64 B 22.30 B 14.53 B 9.98 B
Common Stock 10.67 B 8.21 B 7.18 B 5.37 B 4.36 B
Capital Surplus —– —– —– —– —–
Revaluation Reserves 0.00 0.00 0.00 0.00 0.00
Other Appropriated Reserves -61.00 M -93.00 M -62.00 M —– —–
Unappropriated (Free) Reserves 0.00 0.00 —– —– —–
Retained Earnings 37.17 B 23.35 B 15.13 B 9.10 B 5.61 B
Equity in Untaxed Reserves —– —– —– —– —–
ESOP Guarantees 0.00 0.00 0.00 0.00 0.00
Unrealized Foreign Exchange Gain (Loss) 35.00 M 28.00 M 61.00 M 70.00 M 19.00 M
Unrealized Gain (Loss) on Marketable Securities -81.00 M 49.00 M -70.00 M -7.00 M 3.00 M
Treasury Stock 0.00 0.00 0.00 0.00 0.00
Total Liabilities & Shareholders’ Equity 75.18 B 47.50 B 36.07 B 25.26 B 17.20 B
Common Shares Outstanding 915.97 M 899.81 M 888.33 M 872.33 M 855.26 M

Apple, Inc. (AAPL) Annual Income Statement

Period Ending FY2010 FY2009 FY2008 FY2007 FY2006
Net Sales/Revenues 65.07B 42.90 B 37.49 B 24.01 B 19.32 B
Cost of Goods Sold 38.47 B 24.95 B 23.80 B 15.54 B 13.49 B
Depreciation, Depletion and Amortization 1.03 B 734.00 M 496.00 M 317.00 M 225.00 M
Gross Income 25.57 B 17.22 B 13.20 B 8.15 B 5.60 B
Selling, General & Admin Expenses 7.30 B 5.48 B 4.87 B 3.74 B 3.14 B
Other Operating Expenses 0.00 0.00 0.00 0.00 0.00
Operating Expenses – Total 551.00 M 911.00 M 930.00 M 1.63 M 1.40 M
Operating Income 18.27 B 11.74 B 8.33 B 4.41 B 2.45 B
Extraordinary Credit – Pretax 1.00 M 3.00 M 0.00 0.00 0.00
Extraordinary Charge – Pretax 175.00 M 97.00 M 0.00 0.00 0.00
Non-operating Interest Income 311.00 M 407.00 M 653.00 M 647.00 M 394.00 M
Reserves Inc (Dec) 0.00 0.00 0.00 0.00 0.00
Pretax Equity in Earnings 0.00 0.00 0.00 0.00 0.00
Other Income/Expenses – Net 133.00 M 326.00 M -33.00 M -48.00 M -29.00 M
Earnings Before Interest & Taxes (EBIT) 18.54 B 12.07 B 6.90 B 5.01 B 2.82 B
Interest Expenses on Debt 0.00 0.00 0.00 0.00 0.00
Interest Capitalized 0.00 0.00 0.00 0.00 0.00
Pretax Income 18.54 B 12.07 B 8.95 B 5.01 B 2.82 B
Income Taxes 4.53 B 3.83 B 2.83 B 1.51 B 829.00 M
Current Domestic Income Tax 2.80 B 2.45 B 2.16 B 1.33 B 675.00 M
Current Foreign Income Tax 282.00 M 345.00 M 275.00 M 103.00 M 101.00 M
Deferred Domestic Income Tax 1.56 B 1.08 B 473.00 M 94.00 M 70.00 M
Deferred Foreign Income Tax -121.00M -35.00 M -75.00 M -16.00 M -17.00 M
Income Tax Credits —– —– —– —– —–
Minority Interest 0.00 0.00 0.00 0.00 0.00
Equity in Earnings 0.00 0.00 0.00 0.00 0.00
After Tax Income Expense 0.00 0.00 0.00 0.00 0.00
Discounted Operations 0.00 0.00 0.00 0.00 0.00
Net Income Before Extra Items/Preferred Div 14.01 B 8.24 B 6.12 B 3.50 B 1.99 B
Extra Items & Gain (Loss) Sale of Assets 0.00 0.00 0.00 0.00 0.00
Net Income Before Preferred Dividends 14.01 B 8.24 B 6.12 B 3.50 B 1.99 B
Preferred Dividend Requirements 0.00 0.00 0.00 0.00 0.00
Net Income Available to Common 14.01 B 8.24 B 6.12 B 3.50 B 1.99 B

Apple, Inc (AAPL) Annual Cash Flow

Period Ending FY2010 FY2009 FY2008 FY2007 FY2006
Net Income/ Starting Line 14.01 B 8.24 B 6.12 B 3.50 B 1.99 B
Operating Activities
Depreciation, Depletion & Amortization 1.03 B 734.00 M 496.00 M 317.00 M 225.00 M
Depreciation & Depletion 815.00 M 606.00 M 387.00 M 249.00 M 180.00 M
Amortization of Intangible Assets 212.00 M 128.00 M 109.00 M 68.00 M 45.00 M
Deferred Income Taxes and Investment Tax Credity 1.14 B 853.00 M 768.00 M 830.00 M 855.00 M
Deferred Income Taxes 1.14 B 853.00 M 768.00 M 830.00 M 855.00 M
Income Tax Credit —– —– —– —– —–
Other Cash Flow 903.00 M 736.00 M 538.00 M 254.00 M 174.00 M
Funds from Operations 17.38 B 8.97 B 7.55 B 4.14 B 2.44 B
Extraordinary Items & Discontinued Operations 0.00 0.00 0.00 0.00 0.00
Funds from/for Other Operating Activities 1.21 B -586.00 M 2.04 B 1.32 B -221.00 M
Incline (Decline) in Receivables -4.86 B -939.00 M -785.00 M -385.00 M -357.00 M
Incline (Decline) in Inventories -596.00 M 54.00 M -163.00 M -76.00 M -105.00 M
Incline (Decline) in Accounts Payable 6.31 B 92.00 M 596.00 M 1.49 B 1.61 B
Incline (Decline) in Income Taxes Payable 0.00 0.00 0.00 0.00 —–
Incline (Decline) in Other Accruals 0.00 0.00 0.00 0.00 0.00
Incline (Decline) in Other Assets or Liabilities 361.00 M 207.00 M 2.40 B 292.00 M -1.37 B
Net Cash Flow/Operating Activities 18.60 B 10.16 B 9.60 B 5.47 B 2.22 B
Capital Expenditures (Additions to Fixed Assets)
Additions to other Assets 116.00 M 69.00 M 108.00 M 251.00 M 0.00
Net Assets from Acquisitions 638.00 M 0.00 220.00 M 0.00 0.00
Incline (Decline) in Inventories 57.81 B 46.82 B 23.00 B 11.74 B 7.28 B
Decrease in Investments 46.72 B 30.68 B 16.24 B 9.42 B 8.31 B
Disposal of Fixed Assets 0.00 0.00 0.00 0.00 40.00 M
Other Uses – Investing 2.00 M 74.00 M 10.00 M -49.00 M 58.00 M
Other Sources – Investing 0.00 0.00 0.00 49.00 M 0.00
Net Cash Flow – Investing 13.85 M 17.43 M 8.19 M 3.25 M -357.00 M
Proceeds from Stock Options 0.00 475.00 M 483.00 M 365.00 M 318.00 M
Other Proceeds from Sale/Issues of Stock 912.00 M 0.00 0.00 0.00 0.00
Com/Pfd Purchase, Retired, Converted, Redeemed 0.00 82.00 M 124.00 M 3.00 M 355.00 M
Financing Activities
Long Term Borrowings 0.00 0.00 0.00 0.00 0.00
Incline (Decline) in Short Term Borrowings 0.00 0.00 0.00 0.00 0.00
Reduction in Long Term Debt 0.00 0.00 0.00 0.00 0.00
Cash Dividends Paid Total 0.00 0.00 0.00 0.00 0.00
Common Dividends (Cash) 0.00 0.00 0.00 0.00 0.00
Preferred Dividends (Cash) 0.00 0.00 0.00 0.00 0.00
Other Sources – Financing 751.00 M 270.00 M 757.00 M 377.00 M 361.00 M
Other Uses – Financing 345.00 M 270.00 M 757.00 M 377.00 M 361.00 M
Net Cash Flow – Financing 1.26 B 663.00 m 1.12 B 739.00 M 324.00 M
Effect of Exchange Rate on Cash 0.00 0.00 0.00 —– —–
Changes in Cash and/or Liquid Items —– —– —– —– —–

Ratio Analysis

Liquidity Ratios for the last two years

Current Ratio (Total Current Assets / Total Current Liabilities):

Year 2010 2009
Total Current Assets 41.68 31.56
Total Current Liabilities 20.72 11.51
Current Ratio 2.01 2.74

The current ratio of Apple decreased from 2.74 in 2009 to 2.01 in 2010, but in both the years, it is above 2 and its current assets were more than twice its current liabilities. This shows the company’s strong ability to meet its short-term obligations as it has obviously no liquidity issues. At the same time, the high current ratio shows that the company might be sitting on a lot of cash. But compared to 2009, the company management thought wisely in 2010 and made some good use of cash. Apple might not be using its current assets or its short-term financing facilities efficiently. By retaining assets like cash, valuable investment opportunities might be lost. Obviously, cash by itself does not generate any returns.

Quick Ratio – (Cash and Equivalents – Inventory) / Total Current Liabilities:

The year 2010 2009
Cash and Equivalents 18.60 10.16
Inventory 1.05 0.45
Total Current Liabilities 20.72 11.51
Quick Ratio 0.85 0.84

The quick ratio of Apple has been stable within these two years. There has not been any significant change. The figures show the company’s strong liquidity. At the same time, this might be a cause of concern for the company because it seems the company is not using its assets to the fullest.

Cash Ratio – Cash / Total Current Liabilities:

Year 2010 2009
Cash 18.60 10.16
Total Current Liabilities 20.72 11.51
Cash Ratio 0.90 0.88

Apple’s cash ratio for both the years is again somewhat similar. It can be seen that the company’s cash itself is almost equivalent to the current liabilities. There may be, however, sound reasons as to why the company is holding so much cash. One interpretation might be that the company is anticipating a difficult time ahead and wants to play safe. Looking at the world financial market, consumer spending is going down and debt funding is in short supply. In such circumstances, a company may need internal funding in order to survive.

Profitability Ratios for the last two years

Profit Margin – Net Income / Sales:

Year 2010 2009
Net Income 14.01 8.24
Sales 65.07 42.90
Profit Margin 0.21 0.19

Apple’s profit margin increased from 19% in 2009 to 21% in 2010. The figures are much better than the industry average. This proves that the company is operating more efficiently than its competitors. Apple was able to generate around $0.20 of net profit for each dollar of sales. It seems, therefore, that the company is performing well enough, not only to recover costs and taxes but also to increase the wealth of the company and its shareholders as well.

Return on Assets – Net Income / Total Assets:

Year 2010 2009
Net Income 14.01 8.24
Total Assets 41.68 31.56
Return on Assets 00.33 0.26

The ROA of Apple increased from 26% in 2009 to 33% in 2010. It means that the company is making good use of its assets in a profitable manner. But there is always a scope for improvement. The same theory applies to Apple as well.

Return on Equity – Net Income / Total Equity:

Year 2010 2009
Net Income 14.01 8.24
Total Equity 47.79 31.64
Return on Equity 0.29 0.26

Apple’s ROE in 2009 was 26% and it increased to 29% in 2010. It means that the company is profitable, from the shareholder’s point of view, and that the shareholders are earning good returns on their investment. In 2009, the return was $0.26 to each dollar, which increased to $0.29 to a dollar in 2010. This of course will help the company in developing confidence with the shareholders, which is a good sign for the company’s reputation and future progress.

Debt Equity Ratio (DER) – Long Term Liabilities / Shareholders’ Funds:

Year 2010 2009
Long Term Liabilities 1.23 4.36
Shareholders’ Funds 0.91 0.90
DER 1.35 4.84

Cash Flow and Fund Flow Analysis

When a person wants to invest his/her hard earned money in the stock market, he/she has to be very cautious. The first thing that he/she should go through is the company’s cash flow statement. It has been observed that normally people look for the earning per share (EPS) of the company. But EPS can be manipulated, whereas Cash Flow cannot be manipulated. Cash Flow gives us a true picture of the company. If a company is expanding and it is profitable, then the graph of EPS and Cash Flow both should move upwards. If the trend is downwards, it means danger. People should not invest in such companies. The following graph shows the corresponding graph of Apple, Inc.

Cash Flow and Fund Flow Analysis

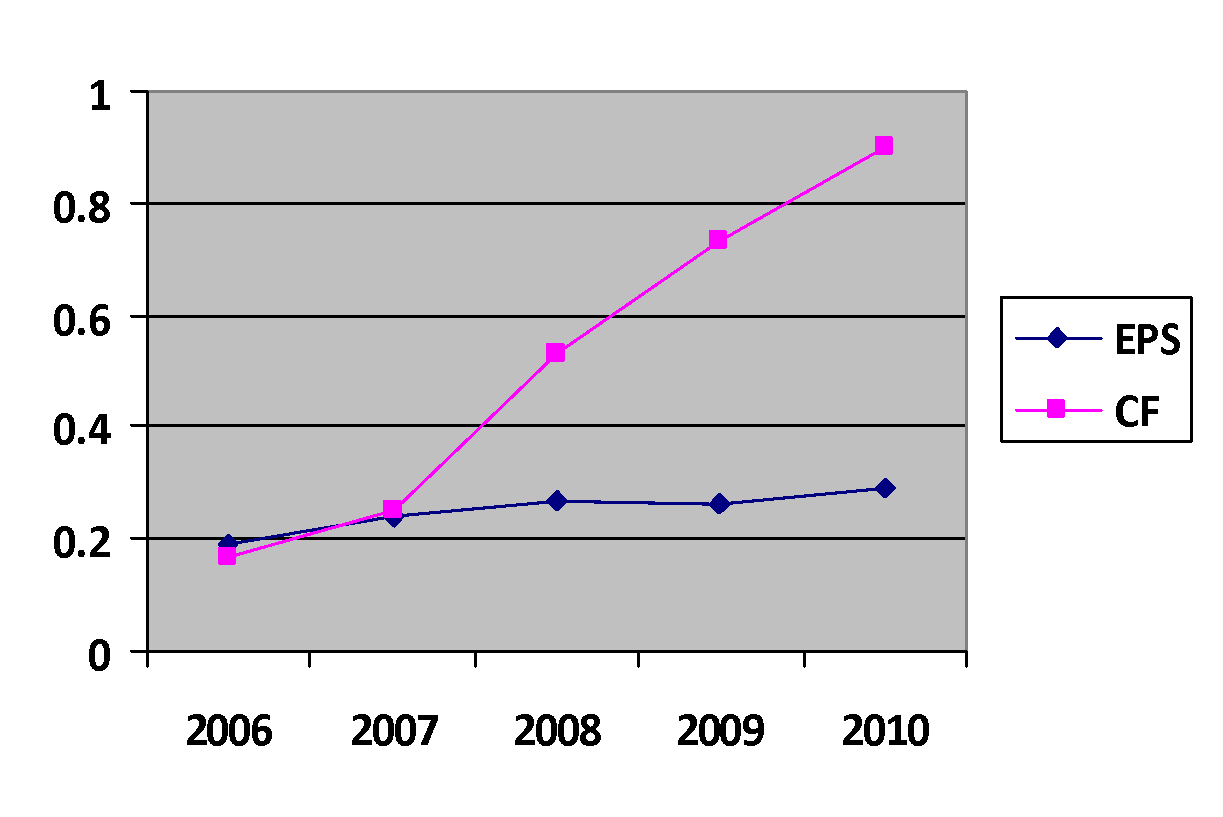
This shows that Apple is a profitable company and investment in this company is safe.

The flow of funds from current assets to fixed assets is called Fund Flow. Following is a graph of comparison between the current assets and fixed assets of Apple.

Cash Flow and Fund Flow Analysis

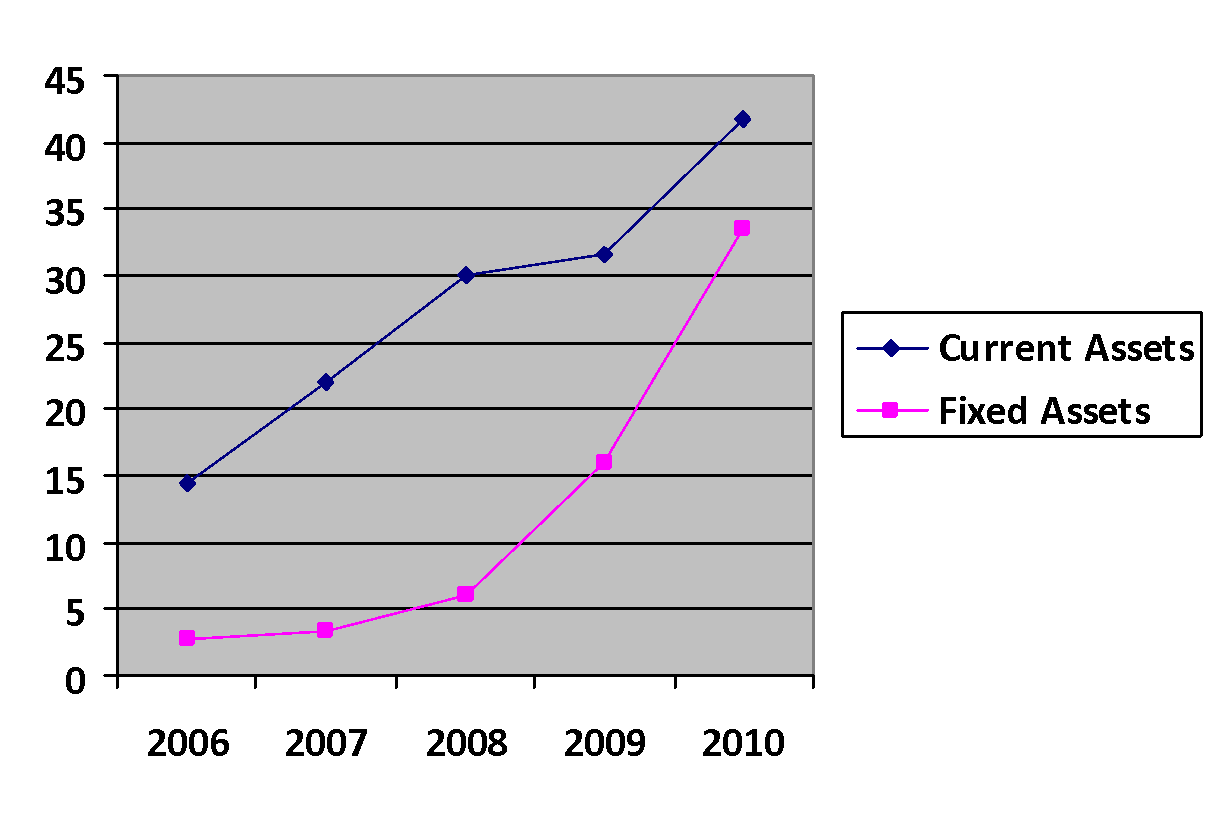
It is evident from the chart that there is n upsurge in both kinds of assets. The company has been very particular on this front. It has used its assets in a very profitable manner. Especially in the last two years, the increase has been remarkable.

SWOT Analysis

SWOT means the Strengths, Weaknesses, Opportunities and Threats of a company. This is a very vast topic but here we shall discuss only with regard to the financial aspect.

Strengths: From the ratios that we have calculated earlier in this paper, it is clear that Apple’s performance in almost all of them has been remarkable. From the current ratio, we know that the company’s current liabilities are almost half of its current assets. It means that the company is capable of meeting its short-term obligations in a perfect manner. The quick ratio proves the company’s strong liquidity. From Apple’s cash ratio it is evident that the company has abundant cash, almost equivalent to its current liabilities. It doesn’t have to worry about the payment of the liabilities. Even the profit margin of Apple has increased through the years. This shows the company’s perfection in its operations.

Weaknesses: The current ratio shows that the company is holding a lot of cash. This cash should be invested in some profitable ventures so that the income graph will further go upwards. Although the quick ratio proves the company’s liquidity, it also shows that the company is not using its assets to the fullest. The cash ratio again proves the same thing.

Opportunities: Owing to modern technological developments, the world, today, is quite dependent on electronics. The future of the electronic market is very bright. With the continuous demand for newer technology, companies like Apple can always survive. Moreover, the present economic environment is quite suitable and encouraging for long-term growth. I am saying this because the technology industry is very susceptible to economic conditions. Most of Apple’s products are gadgets. If the financial position of people is good, only then they will think of buying such gadgets. Moreover, the upward graph of Apple at the stock market is a sign of growth, present and future.

Threats: The main threat to any company is from its competitors. For Apple, its main competitors are Dell and HP. Both these competitors are also doing well, which is a point of concern for Apple. In order to survive in the competitive market, Apple has to concentrate on its R&D department and come out with more innovative products with a price tag that is affordable. The present prices of Apple are on the higher side. But since they are good, people buy them but what if other companies launch similar products at lesser prices? Another negative feedback about Apple is that Apple products are not compatible with some of the software being used by various companies.

Cite this paper

Select style

Reference

BusinessEssay. (2022, December 17). The Analysis of Apple Company. https://business-essay.com/the-analysis-of-apple-company/

Work Cited

"The Analysis of Apple Company." BusinessEssay, 17 Dec. 2022, business-essay.com/the-analysis-of-apple-company/.

References

BusinessEssay. (2022) 'The Analysis of Apple Company'. 17 December.

References

BusinessEssay. 2022. "The Analysis of Apple Company." December 17, 2022. https://business-essay.com/the-analysis-of-apple-company/.

1. BusinessEssay. "The Analysis of Apple Company." December 17, 2022. https://business-essay.com/the-analysis-of-apple-company/.


Bibliography


BusinessEssay. "The Analysis of Apple Company." December 17, 2022. https://business-essay.com/the-analysis-of-apple-company/.