Introduction
BP PLC is an international gas and oil company incorporated in the UK with its headquarters in London. The company majors in the refining of petroleum products. BP corporation internationalized its operations in other 80 countries across the world while maintain provision of high quality products and services to its clients. Some of the products offered include light and heat energy, petroleum and its products among many other products. The companys line of operation is divided into two segments; production and exploration and refining and marketing. Its production and exploration activities majorly include field development, exploration of natural gas and oil and production. In addition, it offers midstream transport, storage services, processing and sales and marketing of natural gas. According to Corporate Watch (2012, p.1), BP is the third largest company in terms of global gas and oil reserves. Its operations are in Europe, Asia, Africa, the Americas and Australasia. Over 70 percent of its profits are generated from its operations in the United States and Europe. In the U.S, BP is the largest gasoline retailer, marketing its products under the brand name AMOCO (Eastern U.S.) and ARCO (West U.S.). In its international operations, BP corporation has an estimated 11,850 outlets with 1,525 outlets situated in UK only while the products offered by the firm are sold in over 100 countries across the globe. BP PLC is also a supplier of fuel energy to some firms in UK and other countries with a good example being Safeway Supermarkets in UK. Apart from fuel and petroleum products that are used by vehicles, the firm supplies the aviation industry with fuel energy utilized in the industry. Consequently, the firm is reported to have an estimate of over 1400 airport contracts in which it is the sole supplier of air fuel (BP 2012, p.1).
BP PLC: History and Development
BP Plc operated using its original name of incorporation for long especially before 1999 in January when the name was changed. The circumstances that led to the change of the company name was a merger that let to change its name used in business operations to BP Amaco. In spite of the changes made, the effect was not felt much since they were short lived. The emerging advertising agency after the merger (Ogilvy & Mather and PR Consultants) opted for BP Plc as the new brand name for the petroleum giant in April of the 2000 financial period. Consequently, the firm established a new logo following its rebranding in 2001.
BP Corporation was established many years ago in 1909 by a British entrepreneur, Wiliam Knox that had gone to establish oil business in Iran. Since its early years of establishment, the firm operated under the name of Anglo Persian Oil, until six decades later that the management thought of changing its name. Although the firm initially focused on the Middle East market, it has changed greatly to acquire a global image following increased globalization and advanced technology. Britain became a major shareholder in the company shortly before the commencement of World War 1, given that the firm had made a promise of supplying the country with steady supply of oil before. As the war progressed, the firm found it necessary to expand its operations to other countries such as Canada, African and Europe among others. As it kept expanding, it also changed its name in 1935 to Anglo Iranian Corporation, a name that the management though would suit its new operations across the world.
Although the firm turned out to be the largest UK foreign direct investment, Iran found a reason to nationalize its assets in 1951. Consequently, the firm began exploration of oil in the Middle East region in countries such as Libya and Kuwait. Given that UK had the largest number of shares in the firm, the firm ended up changing its name in 1954 to British Petroleum Company with the firm being in a position to diversify its operations further towards the U.S. in the 1960s. These new segments became profitable by the mid 1970s and were instrumental in the company reformation. They successfully enabled BP navigate the oil price shocks of 1973 and 1979. Today the company operates in nearly 90 countries across the globe (BP 2012, p.1).
Despite being the largest shareholder, the UK government pursued the privatization policy that saw it selling its last shares in the firm in 1987 with the outcome being serious poor performance issues in the company emerging. The investment ventures that had been undertaken by the firm did not bear profits but losses. In the year 1992, the company registered losses in its financial accounts and it had to undertake drastic cost reduction strategies. Key individuals credited for turning around the company include; Peter Sutherland, Lord Simon of Highbury and the immediate former CEO John Brown. BP had a 55 percent ownership share in the U.S. Standard Oil Company and by 1987. It successfully acquired the remaining 45 percent and founded BP America. In august of 1998, it entered into the globe largest industrial merger with the American Oil Company.
BP PLC: Latest Developments
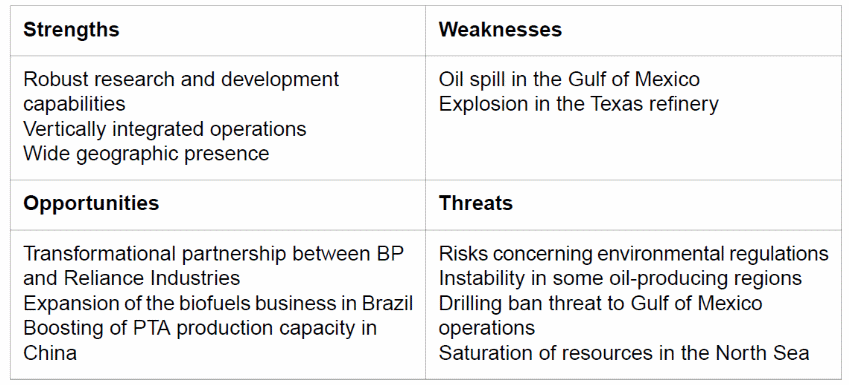
- April 2010: Oil spill in the gulf of Mexico shakes BP reputation and profitability
- Dec 2011: BP sold Naphtha cargo to Vitol
- Nov 2011: Wood Goup Kianda secures BP contract before the Launch
- Nov 2011: ABB officially begins the installation EV fast Charges at BP service stations in the Netherlands
- Nov 2011: BP purchases Naphtha from Glencore
- Nov 2011: BP secured two blocks in Indonesia for exploration
BP Financial Analysis
The following ratios are used to analyze the performance of BP, and a comparison will be drawn from the two most recent years 2010 and 2011.
Profitability Ratios (Appendix Table 2)
Gross Margin
This ratio highlights how well inventory and manufacturing costs are controlled by BP and how the costs are finally passed over to the consumers. The gross margin was 15 percent in 2010 and declined to 15 percent in 2011. Even with the slight decline, the company is still in a sound financial position (Beattie et al 2006, p.75).
Operating margin
According to Allen (2003, p.6), this reflects BPs earnings before the deduction of interest and tax indicted as a percentage of its sales revenues. In 2010 and 2011, BP had an operating margin of 9 percent and 8 percent respectively. The drop is largely due to the loss incurred as a result of the oil spill in 2010 (BP PLC Sustainability Case Study 2010, p.1)
Net profit margin
In 2010, each dollar of BP sales generated 6 cents in profit. For 2011, each dollar of sales generated 7 cents in profit for BP. After accounting for all its expenses, the company had a profit of 6 and 7 cents per dollar of sales respectively (Brealey et al. 2000, p.6).
Return on Assets
Measures how efficient BPs management is in managing the companys asset investments to generate profit. The return was significantly high in 2010 with 1107 percent. However, in 2011, it dropped to 403 percent. Even though the 2011 rate is still high, the operating profit was quite high and may be related to the closure of its operations in the Mexican Gulf. Overall, the company is performing well in the generation of sales from its assets (Collier 2003, p.34).
Return on Equity
This is one of the most critical ratios for BPs investors. It indicates the approximate amount the investors will earn if they inject their capital in BP. The percentage for BP remained high for the two consecutive years, 449 percent and 433 percent respectively. BP is an attractive choice for potential investors as it generates good returns (Duchac 2008, p.5).
Liquidity Ratios (Appendix Table 3)
Current ratio
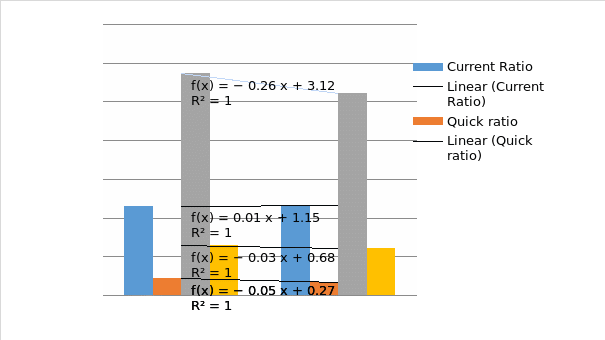
Highlights the companys ability to promptly repay its short term obligations. BPs current ratio indicates a slight increase of 0.1. In 2010, the company had a quick ratio of 1.15 and in 2011, it increased to 1.16. Although the ratio is still low because the ideal ratio should be 2:1, there is no cause for worry for BP because it exceeds the required minimum of 1.
Quick Ratio
Quick ratio is computed as the ratio of cash and cash equivalents to the current liabilities. BP registered a decrease in its quick ratio from 0.22 in 2010 to 0.17 in 2011. This ratio is lower than the ideal 1:1. This implies that BP as a company heavily relies on other assets, more so inventory to meet its short-term obligations (Van Horne et al. 2001, p.222). Many lenders have an interest in this ratio as it excludes inventory which may take more or less time before it is converted into cash depending on the nature of the product (Gitman 2000, p.45).
Debt to Equity Ratio
According to Hansen (2000, p.42), the ratio indicates the extent to which BP as a company relies on borrowed funds to finance its operations. In the two fiscal years 2010 and 2011, the debt to equity ratio for BP reduced from 0.65 in 2010 to 0.61 in 2011. Ideally, the ratio should stand at 2:1. The low ratio indicates that BP does not rely so much on debt to finance its operations. The company budget heavily for the Gulf of Mexico oil spill, but even with the huge expenditure, the company has not borrowed much thereby becoming financially sound (Weiss 1998, p.221).
Efficiency Ratios (Appendix Table 1)
Days Inventory
The inventory period for BP improved from 31 days in 2010 to 29 days in 2011. The days inventory represents BPs holding period. The company has a good Days Inventory that could be partly explained by the fact that the demand for gasoline across the globe is high and companies like BP are reducing the holding period to meet the demand. This means that the production segment at BP is equally doing a good job (Mowen 2000, p.34).
Inventory Turnover
This is the ratio of total sales to inventory for BP corporation and indicates BPs efficiency as it shows the speed at which the company sells its products and services (Warren 1998, p.444). In 2010, it the company had a turnover of 11 times, while in 2011 it was 12 days. It means that in one month the company can replace its stock 2- 3 times (Van Horne 2001, p.11).
Asset Turnover
In 2010, BP had an asset turnover ratio of 3.6 while in 2011, the ratio dropped to 1.8. The ratio tells us the link between BP’s revenue and its assets, which are the sales generated for each dollar worth of assets (Moyer et al. 2001, p.100). The drop in the 2011 asset turnover ratio can be associated with the increase in net profit margin for BP (Lasher 2000, p.10).
A table showing the calculated ratios for the firm.
Use of a Balanced Scorecard
Introduction
Balanced Score Card is a strategic planning tool and a management system that is used to realign a companys business activities to its vision statement. It transforms the companys unclear mission/vision into practicable steps that enhance better business management. The Balanced Scorecard was formulated by two prominent doctors (Norton and Kaplan), from the initial Metric Driven Incentives (MDI). The MDIs were primarily centered on a firms financial aspects. The Balanced Scorecard for BP PLC will give a holistic view of the company and coordinate the metric driven incentives resulting in increased efficiency in all the BP departments. For the company to successfully use the Balanced Scorecard, the following must be well understood from the start. The strategic vision of BP PLC and the companys mission statement. In addition, there must be sufficient information relating to BPs financial position, the companys current structure and operation, the level of customer satisfaction in addition to the quality of BPs human capital (Saraiva 2011, p.53).
Using the Balanced Scorecard to Improve Overall Performance of BP PLC
In order to improve BPs overall performance, four perspectives need to be considered in the balanced scorecard. These perspectives include: the first is the financial perspective in which two primary variables are considered, the companys revenue growth and productivity (Saraiva 2011, p.53). In order to boost its revenue growth, BP has continued to expand its sales beyond gasoline by offering the consumer’s convenience products and services (Reeve 2005, p.23). In addition, the company offers added automotive services for instance changing motor vehicle oil, antifreeze and wiper fluid for its customers (Ross, Westerfield & Jordan 1998, p. 89). It equally performs replacement of common parts like wiper blades and tires. The company sale of premium brands like Castrol and BP boosted its profitability margins. The specific metrics that can be adopted to measure the financial performance under BSC include the profit margin, the ratio of the premium products sold to regular products, its sales volume relative to the industry and the revenue arising from non-gasoline products. On Productivity, BP has been working towards reducing its operating expenses for each gallon sold to a minimum level in the industry and get more from its existing assets by significantly cutting shortening the downtime within its refineries and increasing output. Metrics that can be adopted to measure this under BSC are the realized cash flow relative to the planned and expenses incurred per gallon relative to the industry expenses (Roy 2001, p.4).
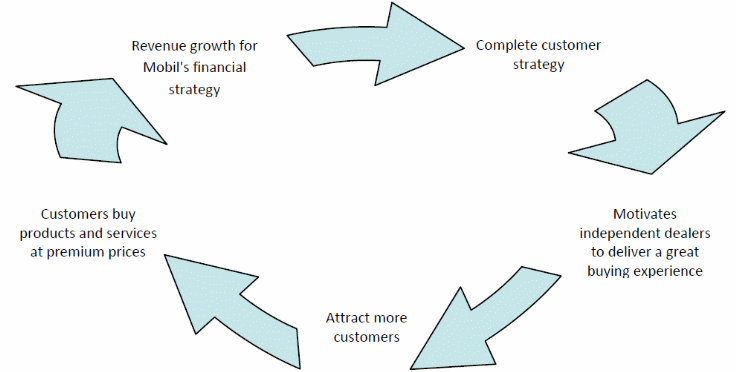
Customer perspective: at the core of BPs’ strategy is its value proposition to the customers, which highlights the unique service features and product mix, corporate image and customer relations which the company offers. These are particularly important in the wake of the 2010 Gulf of Mexico oil spill. BP has described how its products are differentiated from the rest of the industry in order to attract new customers, retain the existing ones and expand its relationship with its target customers (Jarrar et al. 2011, p.43). This has translated into a strategy under which BP targets its premium customer segments by offering them instant access to gasoline pumps with clean restrooms, well lit stations, self payment system, friendly employees and convenience stores that offer fresh and high quality merchandise. To measure these metrics, the company can adopt the following metrics; its share of the target market segment and shopper experience rating for the company. To BP, the consumers buying experience is more central to their strategy and it as a result of this that the company invested in a new system of “mystery shoppers”, that will provide the metrics for measuring its performance in this area. These shoppers are requested to assess their buying experience based upon a number of criteria. BPs immediate customers are the gasoline station owners and they therefore form a critical part of the customer perspective. It is therefore important that BP includes two additional metrics to its customer perspective; dealer satisfaction and dealer profitability. The customer perspective leads to BPs increased profitability through the following cycle:
BP’s internal process perspective involves the development of the franchise by creating new products and services for instance improving customer value through training the dealers to be better managers and improving their sales from convenience stores. This will help the organization generate additional profits from non-gasoline services and products. By diversifying their operations, the company will rely less on gasoline sales. BP has always had the intention of understanding its customer segments and build high quality franchise teams. They equally want to improve their inventory management and hardware performance and deliver their products and services just in time. As part of its Corporate Social Responsibility initiatives, the company wants to eliminate the possibility of environmental accidents like the 2010 oil spill. To measure the effectiveness of all these strategies the company can choose to use the following metrics: new product return on investment, the rate of acceptance of new products, its share of the target market, its dealership quality rating, stock out rate, inventory levels, refinery yield gap, unplanned downtime, competition against activity based expenses and lastly minimum number of safety accidents and environmental incidents.
By adopting the four perspectives, BP will develop a holistic strategy map that will link the different business units and service departments. This will help the company to detect and take corrective action on major loopholes in the organizations strategy at all levels. The use of BSC in appraising performance will most likely increase BPs operating cash flow, improve the return on capital employed, increase dealership quality, minimize safety accidents and promote workforce awareness and commitment to the strategy.
Summary
The companys recovery from the Gulf of Mexico oil spill within a short duration clearly points to the strength BP commands. The loss was significantly bigger, however the management has remarkably dealt with the situation and the overall performance of the company was not affected much. BP remains a viable investment choice. By using the balanced scorecard approach, the company can constantly upgrade its products and services, in addition to expanding and improving its current technology (Crosson 2010, p.110). Here are the performance tables for the company.
Cash flows
Conclusion and Recommendations
From the analysis of firm specific factors that influence capital structure, it is clear that the findings are in line with those of previous literatures on developing markets. Future growth prospects, profitability, size, growth, tax shield, operating risks and the level of fixed assets appear to influence the level of both short term and long-term debt.
The findings from the assessment of financial debt and trade creditors point to the fact that market-book ratio and tax shield significantly influences only the level of financial debt as projected but not on trade creditors. Taxation on the other hand has no influence trade creditors but positively influences financial debt. The empirical findings support the pecking order and trade off theories. Firms prefer to finance their operations through debt when the tax benefit associated with financial debt is high. This supports the trade-off theory. In addition, BP’s corporate oil market is still expanding globally and as such when the economy suffers from a recession, firms are pushed to rely more on short term debt. This supports the pecking order theory (Morningstar, 2012).
Generally, companies are usually able to maintain the book leverage levels that existed prior to recession. They achieve this by counterbalancing their decreased book value of equity arising from the losses induced by the recession, with reduced debt and dividend levels. Despite the existence of a recession, available evidence suggests that management is actively involved in the management of the capital structures. It is expected that such managerial efforts in conjunction with increased stock prices in the end, will probably restore the market leverage level that existed before the recession.
The findings from the previous studies indicated that companies with limited fixed assets, small profits, less debt and a small market to book ratio are more likely to raise their capital by issuing rights to their existing stockholders. Therefore, small upcoming companies with few fixed assets and low bottom lines may not be in a position to finance their investments through bank loans. They therefore choose to raise the funds though their stockholders. The addition of the recession variables into the model, points to the fact that both recessions (the 1994 and the 2000-2001 recessions) positively influenced the decision by management to issue rights. When these findings are analyzed together with the leverage findings, it can be concluded that companies tend to reduce their debt levels during recession periods and resort to financing their operations through the issuance of rights when sudden and drastic economic recession occurs.
References
Allen, S 2003, Financial risk management: A practitioner’s guide to managing market and credit risk, John Wiley &Sons, New York.
Beattie, V, Goodacre, A & Thomson, S 2006, International lease accounting reform and economic consequences: The views of UK users and preparers, International Journal of Accounting, vol.41, no.1, pp.75-103.
BP, 2012, Our Operations, BP, Web.
Brealey, R A & Meyers, C 2000, Principles of corporate finance. 6 edn, McGraw Hill Publishers, Irwin.
Collier, P 2003, Accounting for managers: Interpreting accounting information for Decision-making, John Wiley &Sons, London.
Corporate Watch 2012, BP Plc-overview, BP, Web.
Crosson, D 2010, Effects of financial and managerial accounting in decision-making, Cengage learning, New York.
Datamonitor, BP Plc 2011: SWOT analysis, Business Source Complete, Web.
Duchac, J 2008, Managerial accounting for decision-making, Pearson International, Boston.
Gitman, J 2000, Managerial finance brief, Addison-Wesley-Longman Inc., New York.
Hansen, W 2000, Financial management, Prentice Hall, New Jersey.
Jarrar, N & Smith, M 2011, Product diversification: the need for innovation and the role of a balanced scorecard, Journal Of Applied Management Accounting Research, vol. 9,no. 2, pp. 43-60.
Lasher, R 2000, Practical financial management, South-Western College Publisher, New Jersey.
Morningstar, 2012, Morningstar market reports, Morningstar. Web.
Mowen, P 2000, Financial accounting as a tool for decision-making process, Routledge, Chicago.
Moyer, C, McGuigan, R & Kretlow, J 2001, Contemporary financial management, South-Western College Publishing, Cincinnati.
Reeve, K 2005, Financial and managerial accounting systems, Hill Top, Florida.
Ross, A, Westerfield, W & Jordan, D 1998, Fundamentals of corporate finance, 4 edn, McGraw-Hill Publishers, Boston.
Roy, J 2001, Financial and managerial accounting for decision-making, SAGE, New Jersey.
Saraiva, H 2011, The balanced scorecard: The evolution of the concept and its effects on change in organizational management, EBS Review, vol.28, pp.53-66,
Van Horne, C & Wachowicz, W 2001, Fundamentals of financial management, 11 edn, Prentice-Hall Publishers Inc., Upper Saddle River.
Warren, P 1998, Company accounting and finance, ABC-CLIO, New Jersey.
Weiss, L 1998, How to understand financial analysis, INSEAD, 01/98-4725
Appendix
Graphs
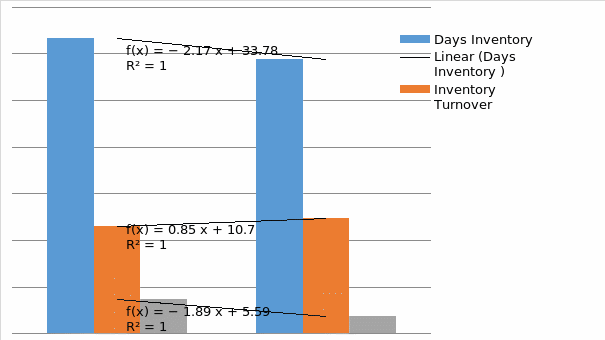
Table 2: Profitability Ratio Table and Graph

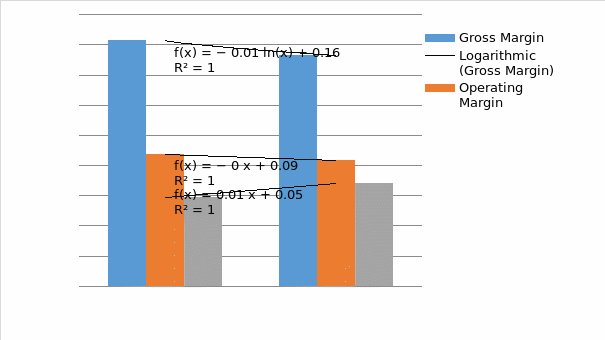
Table: 3 Liquidity Ratio Table and Graph

