Executive Summary
The report represents an analysis of the performance of Billabong International Company, a clothing company that has been in existence since 1973 in Australia. The company has been listed and trading its securities in the Australian Securities Exchange since august 2000. The report analysis the financial reports of year 2010 and making comparison with some of those of 2009 in order to determine the changes in the ratios. The performance is assessed using the financial ratios like profitability ratios, asset efficiency ratios, liquidity ratios, gearing ratios and investment ratios. These ratios are computed using the financial statements for 2010 financial year. The profitability ratios used include return on equity, return on assets and profit margin. These ratios evaluate the firm’s earnings, level of assets, share value or even the amount of owner’s investment in relation to a given level of sales. Liquidity ratios like quick ratio, acid test ratio and cash ratio are used to assess the firm’s ability to pay for its short term financial obligations. Turnover ratios like stock turnover and others are used to measure the firm’s efficiency in using resources to generate sales revenue. Investment ratios like earning per share, price earnings ratio among others are used to measure the extent to which the investment is paying the investors (Bernstein $ Wild, 1999). All these ratios help the financial analysts to have a 360 degree view of the firm’s performance. Ratios do not make sense unless they are compared with those of other firms or the same firm in different financial periods.
Company overview
Billabong International Company is a company that deals in retailing and wholesaling of skate, surf and snow apparel and accessories across the world. These were also the major continuing activities of the company in the year 2010. The company’s other revenue generating activity is licensing of company’s trademarks to some regions around the world. The operations of the firms are organized in to segments in different countries across the globe. Some of these segments include America, Australasia, and Europe among others. The American segment is made up of Canada, United States of America, Peru, Brazil and also Chile. The Australasia section is made up of countries like Japan, Australia, and South Africa New Zealand among others. There is also European segment that is made up of German, France, England and other countries near that region. The other segment included the third party royalties or third party operations. The revenues collected from different segments in thousand dollars include Australasia $425, 663, Americas $712, 633, Europe $34, 023 and third party royalties $2, 009. Based on the annual financial reports for 2009 and 1010 financial years, the company performance has declined by some indicators. For instance total assets declined from $2,220,512, 000 in 2009 to $2,210,319,000 in 2010. More information about the company’s performance will be shown in the following sections. This entails the analysis of the financial statements for 2010 using ratios.
Analysis of Billabong International Company
Profitability ratios
The ratios to calculate in this case include: all figures are in thousands
Return on equity
This ratio indicates the return of profitability that is yield by one shilling of equity capital that was invested by the shareholders (Correia, Flynn, Uliana, & Wormald, 2007.). The ratio is calculated as follows:
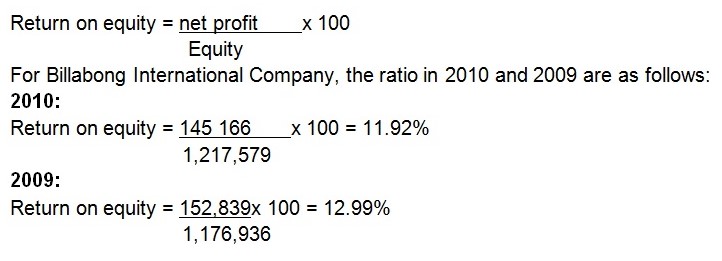
The ratio shows that every shilling of equity capital yielded $11 of the $100 of profit generated that year. The ratios seem to have decreased in 2010 by about 1%. The company performed better in 2009 than 2010.
Return on assets
This ratio shows the profit earned by one shilling of total assets invested. It is calculated as follows:
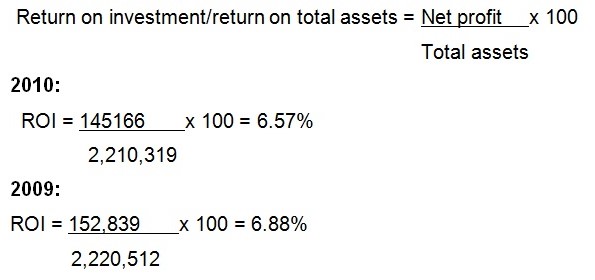
The ratio shows that in 2010, for every 100 units of profit generated, 6.57 units were attributed to the total assets. This is a decline from 2009 where total assets contributed to 6.88 units for every for every 100 units generated.
Net profit margin
This measures the ability of the firm to control financing expenses in a given interest expense.
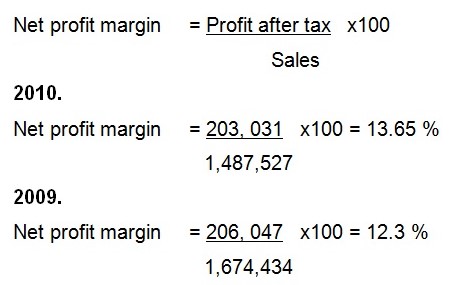
The ratio expresses net profit as a percentage of sales. The higher the ratio the better is the firm in controlling its financing expenses in a given level of interest expense. In 2010, the company had a higher margin than in 2009. The net profit after tax that was generated by sales revenue was $13 for every $100 of sales revenue.
Return on Capital Employed (ROCE)
The ratio shows the amount of net profit that is contributed by every unit of capital employed or net assets. It is calculated as follows:
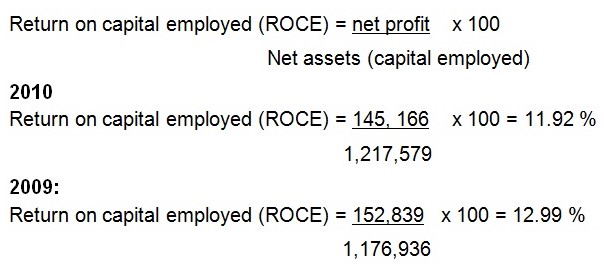
For every 100 units of capital employed in 2010, 11.92 units of net profit was generated. This is a decline from the 2009 figures where every 100 units of capital employed yielded 12.99 units of capital. The firm was therefore better in 2009 than 2010.
Liquidity ratios
These ratios measure the firm’s ability to settle its short-term financial obligations. They include:
Current ratio
This indicates the number of time a firm can pay for current liabilities with the available current assets before the latter is exhausted. The recommended level of this ratio is 2.0. It is calculated as follows:
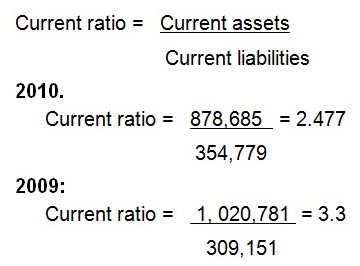
The current ratio for 2010 shows that there is $2.477 of current assets that is available to pay for $1 worth of current liabilities. The ratio is less than what was recorded in 2009 where $3.3 worth of current assets were available to pay for $1 worth of current liabilities. The firm’s liquidity is sound based on this ratio since it is about the recommended current ratio, 2.0.
Quick ratio
This is a more refined ratio than the current ratio and it excluded stock from the current assets as they are least liquid. It is also called Acid test ratio. The recommended level of this ratio is 1.0.
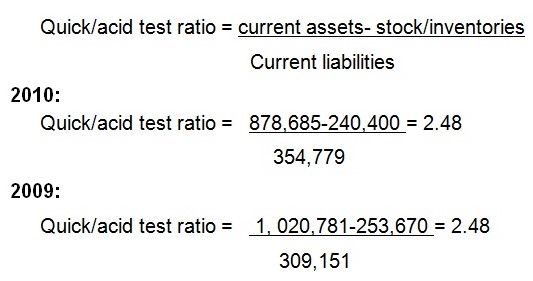
The firms liquidity also seems sound based on the acid test ratio. Without the inventories, the firm is still able to cater for its short term financial obligations. The ratio remained the same in 2010 as in 2009.
Cash ratio
This ratio measures whether the firm is able to pay for its short term financial liabilities using liquid funds (cash in hand and cash at bank). The recommended level of this ratio is 1.0. It is computed as under:
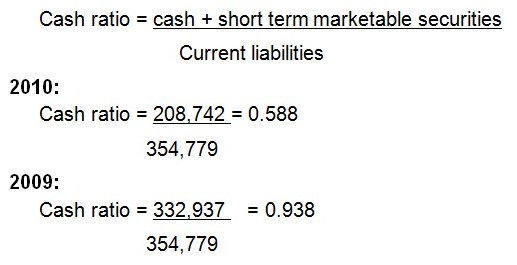
The cash ratio in 2010 was not sufficient to pay for current liabilities. The recommended level is 1.0. In 2009, it was better since it was close to 1.0.
Asset efficiency ratios
Inventory turnover ratio
This is a measure of frequency with which stock was turned into sales in the year. When the ratio is high, the firm is better and the sales are higher.
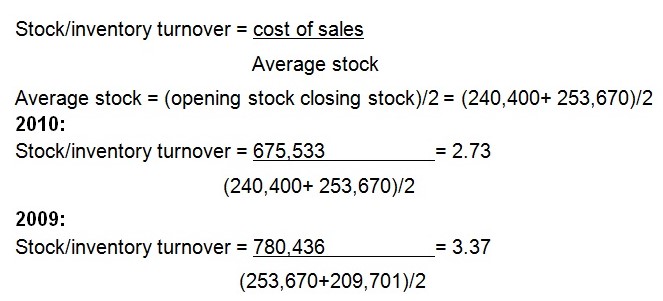
The stock was turned to sales in 2009 faster than in 2010 since the stock turnover ratio declined in 2010.
Stock holding period
This indicates the period of time that stock remained in the warehouse before it was sold.
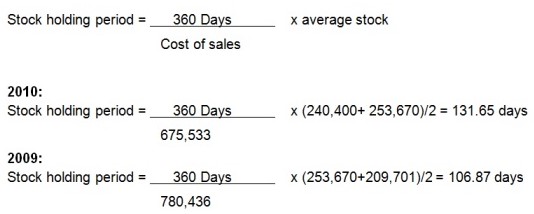
The period of time stock remained in the warehouse before it was sold was 131.65 days which was higher compares to 106.65 in 2009.
Total assets turnover
The ratio shows the amount of sales revenue generated from one dollar of total assets that is used by the firm.
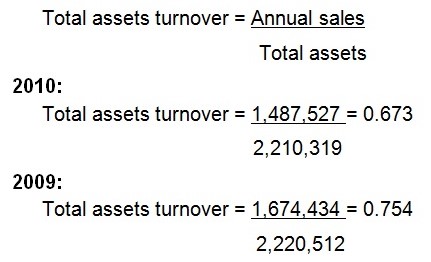
In 2010, a dollar worth of total assets generated $0.673 worth of sales. This was a decline compared to $0.754 in 2009.
Gearing/ leverage ratios
The ratios indicate the extent to which the assets of the company are funded by the borrowed capital or by the owners (equity capital).
Debt to equity ratio
This ratio expresses the debts (borrowed capital) as a percentage of equity capital. The ratio is calculated as:
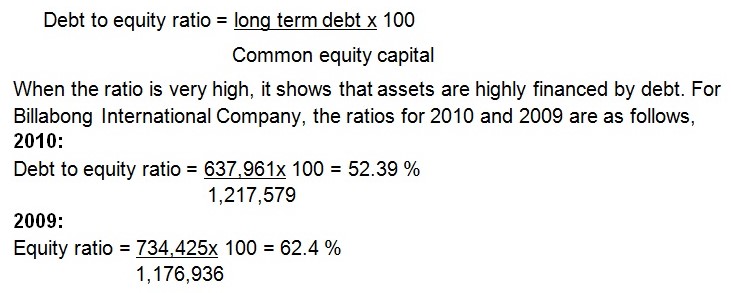
The ratio shows that in 2010, for every 100 units of assets value, 52.39 is financed by debt. This is a decline from 2009 where the ratio was 62.4%. The firm was therefore better in 2010 than 2009 with respect to this ratio.
Debt to total capital ratio
The ratio expresses the debt (borrowed capital) as a percentage of total capital. It shows what percentage of total capital is borrowed capital. The ratio is computed as below:
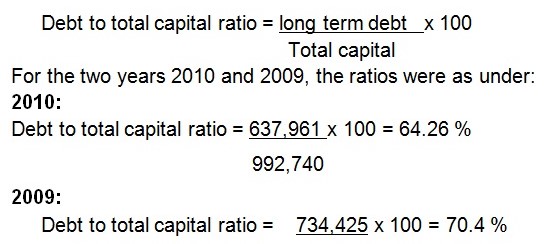
The ratio shows in 2010 that, 64.26 percent of total assets were financed by debt or outside investors. The ratio was higher in 2009 than in 2010.
1,043,576
Investment ratios
These ratios measures the extent to which the investment of the shareholders is paying back to them. They help the investors know whether it is worthy to invest in the company or not. To calculate these ratios, the following information is crucial:
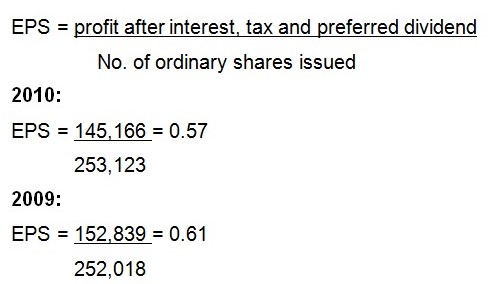
Earnings per share (EPS)
The ratio is an indicator of the earnings power of the firm. It shows how much profit is attributed to the shares that the investors hold with the company (Brickely, 1983). The firm is better when the ratio is higher.
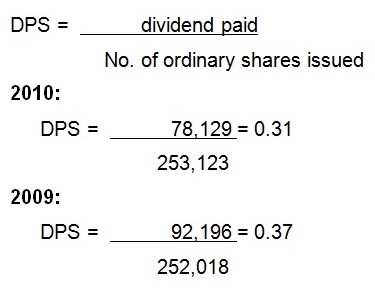
Dividend per share (DPS)
The ratio indicates the cash dividend that is received for each share that an investor holds with the company.
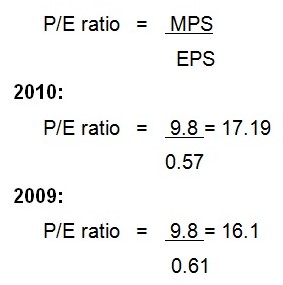
Price/ Earnings ratio
The MPS is the price at which a new share is worth and can be purchased. EPS is the income for each share in a year (Bragg, 2003). Hence, P/E ratio shows the number f years that is needed in order to recoup MPS from the annual EPS of a company.
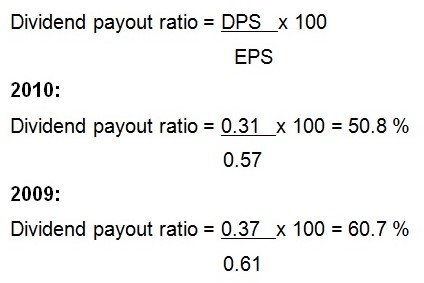
Dividend payout ratio
The ratio shows the amount of earnings that were paid out as dividends. It is computes as follows:
Retention ratio
Retention ratio =1- dividend payout ratio (DPR)
2010: Retention ratio = 1 – 50.8 % = 49.2 %
2009: Retention ratio 1 – 60.7 % = 39.3 %
Dividend Yield
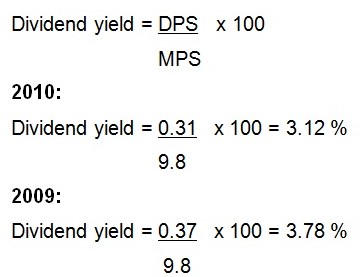
For all investment ratios apart from the P/E ratio, there was a decline 2010 figures compared to 2009 figures. It means that the value the investors get from the shares they hold decreased in 2010. The factors for this could be political factors, company’s performance among others.
Conclusion
The performance of Billabong International Company seems to have declined in 2010. Most of the indicators of performance revealed that the company’s performance declined in performance in 2010 compared to the same indicators in 2009.
Reference List
Bernstein, LA, Wild, J., 1999. Analysis of Financial Statements, 5th Edition. New York: McGraw-Hill Professional.
Bragg, S. M., 2003. The new CFO financial leadership manual. London: Wiley.
Brickely, J., 1983. Shareholder Wealth Information Signaling and the Specially Designated Dividend. Journal of Financial Economics, 12: 187-210.
Correia, C., Flynn, D., Uliana, E and Wormald, M., 2007. Financial Management. South African: Juta and Company Ltd.