Introduction
The Country Analysis
Country analysis underlies many a political and commercial decision, not least because of the realities of geopolitical alliances, the globalization of supply chains and markets, and even simple trade in finished goods. Governments, financial institutions, and industries all need to discern or update themselves on the reliability and stability of their counterparts in other nations and the long-term prospects.
Accordingly, country analysis typically embraces an extensive range of political, macroeconomic, domestic business prospects, and cultural factors (Economist Intelligence Unit, 2008) such as:
The structure of the economy: leading industrialized nation, less developed country, agricultural economy, destabilized by insurgency and conflict, etc.
An overview of macroeconomic fundamentals and political developments since the government is such an active participant in mitigating or aggravating the business environment. Since the current recession commenced, for instance, fiscal policy in the United States, the U.K., Australia, Japan, Germany, Australia, and France have all been heavily skewed towards ameliorating the worst effects of an economic downturn. Or at least being seen to inspire confidence that an upturn is in sight.
The near-term outlook for politics, economics, the domestic business environment, foreign trade, balance of payments, and exchange rate trends, among others. Given how dynamically all such factors behave, constant updates are crucial. Two months ago, for example, no one could have predicted that the party of the current Prime Minister would upset the longstanding monopoly of the Liberal Democratic Party and forthwith distance the nation from the U.S. and the fight against the Taliban in Japan, even though the island nation depends heavily on America for trade.
A “long view” analysis of production, prices, inflation, exchange rates, loans, retail sales, imports and exports, and foreign direct investment with a view to building models for predicting near- and medium-term change.
Purpose of the Analysis
For any given country analysis, the emphasis will likely depend on the purpose for which it is developed. In broad terms, the country analysis seeks to minimize risk by spotlighting opportunities and drawbacks for any investment of political goodwill, human capital and financial assets (Spulber, 2007).
For one, multilateral funding institutions and regional development banks may be concerned with the future potential of an economy currently sunk in a morass of external shocks, recession, and significant exchange rate instability. The International Monetary Fund may well remain wary of South Africa repeating the foreign debt crisis of 1985 when foreign banks like Chase Manhattan refused to reschedule $14 billion of debt.
A second purpose for embarking on country analysis is when foreign direct investors wish to explore putting up subsidiaries in Japan and South Africa. In that case, the analysis will put priority on restrictive labor laws (e.g. favoring indigenous peoples in South Africa), policies about profit repatriation, and openness of local industrial/consumer markets to foreign-brand suppliers (non-tariff barriers being a fact of life in Japan, for instance).
Brief on Countries
Japan and South Africa present contrasting pictures. Where one is a monolithic dynamo of world commerce and unsullied by colonization, South Africa has surged to become the largest economy in the African Union, industrialized-nation status with the Group of 20 (and even the G-8 plus 5) despite centuries of colonization, of ethnic, linguistic and religious diversity (World Economic Forum, 2009, pp. 282-3).
Except for coral and marine life, Japan has virtually no natural resources. After the Meiji restoration and the forced opening up to foreign contact and trade, Japan strove for a larger presence on the world stage. Early in the last century, the nation showed its mettle by beating Russia (many times its size) at Tsushima and Port Arthur. Japan enslaved Korea and Manchuria prior to conquering all of East Asia in World War II. Defeated in 1945, the Japanese scrambled back to become the second-largest economy around the globe by late in the 20th century, yielding that status to China only in recent years.
Like Japan, South Africa already boasted recognizably human habitation for at least 100,000 years, back to the Late Stone Age. The early Bushmen, joined by Xhosa and Zulu immigrants from elsewhere in central and eastern Africa, came under Dutch Boer and English rule principally because of the nation’s strategic location on the sea routes between Europe, India and the Far East. The discovery of rich gold deposits in 1886 and subsequently, diamonds and uranium launched this largely arid country toward the bustling industry and trade it enjoys in contemporary times. The political compromises and fragmentation of South Africa are best illustrated by the fact that the three branches of government are dispersed throughout Bloemfontein (the judiciary), Pretoria (the executive), and Cape Town (the legislature), none of them being anywhere as large as Johannesburg (Central Intelligence Agency, 2009b, p. 1).
Discussion of Forthcoming Chapters
Section 2 below reprises the political and socio-economic information about both Japan and South Africa. Subsequently, section 3 discusses the purposes of economic analyses in greater detail and compares the performance of both nations on every important indicator of macroeconomic performance. This is followed by comparative scrutiny in section 4 of the comparative advantages inherent in geographic location, domestic resources, human and social capital. Finally, section 5 introduces the regression-based estimate of gross domestic product and per-capita income for the two nations involved, together with a reappraisal of critical strengths, opportunities and weaknesses.
The Countries
Political Information
The emergence of the Democratic Party of Japan’s Yukio Hatoyama as the new Prime Minister in elections for the Lower House last August brought to a head dissatisfaction with the decades-long monopoly of the Liberal Democratic Party and with the recession – the second the nation experienced in less than two decades – that triggered homelessness and record unemployment. For the first time, a G-8 leader admitted what decades of apparently isolated bribery scandals had already made obvious: corruption was rife in the government bureaucracy and willing “donors” among the great zaibatsu were responsible.
This is old news in Asia. From South Korea to mainland China, Hong Kong, the Republic of China, Thailand, the Philippines, and Indonesia, Presidents, Dictators-for-Life and Prime Ministers had been unseated and even jailed for massive graft in modern (postwar) times. The difference was that an advanced, industrialized country like Japan admitted to losing untold trillions of yen to bureaucrats and “sararimen”, funds that could otherwise have gone to pump-priming the economy in the last two recessions. The newly-dominant DPJ now hopes to halt these revenue losses to have funds for, among others, unemployment benefits and incentives to married couples to have more children (World Bank, 2008; Voice of America, 2009).
In quick succession, Hatoyama also moved to loosen dependence on America as a signal to the electorate that the nation could no longer rely on the United States to be the global engine of growth through the massive trade deficits the U.S. ran a year after year with both China and Japan. Perhaps, the initial moves seemed cosmetic: refusing to renew the lease on an airbase in Okinawa and withdrawing even the token presence of refueling tankers that serviced Coalition navies still involved in Afghanistan. Certainly, Japan may seek closer ties with Russia and China but is unlikely to ally itself overnight with rash states like North Korea or Iran. Nevertheless, the publicly-declared autonomy of the Japanese government could not have failed to dismay a U.S. president who arrived in Tokyo for bilateral talks in early November still talking up the idea of sending more American ground troops to Afghanistan (Voice of America, 2009).
The problem of Japan is that it truly has no natural resources of its own and must depend on trading partners for both access to raw materials and markets for its finished goods. Meanwhile, there is East Asia where countries like the Philippines and China proved more resilient in not skidding into outright recession as Japan, Europe, Australia, and North America did commence the second half of 2007. But the fact is, Japan had never neglected East Asia. While still paying reparations for war damages after World War II, Japan was already exporting the first generation of Toyotas to the resource-rich economies of the region as a testbed for invading the biggest automobile market on earth.
Despite official pronouncements that the Japanese economy began a definite rebound in August this year, the new leadership needs to condition its constituents that the era of export-led growth may never return. Perhaps there will be trade opportunities with the massive Chinese market. But People’s China has already reached the stage of import-substituting industrialization that signaled the emergence of South Korea. Therefore, Hatoyama needs the Japanese to rally behind him in “trickle-up” economics, the belief that increasing the disposable income of the man on the street (and even reducing the remarkable savings rate) will so strengthen domestic demand this will replace some of the growth impetus that consistently massive export surpluses used to provide.
While Japan has had the advantage of cohesiveness in ethnicity, language, the Shinto “religion”, and obeisance to the emperor, South Africa has been distinctly hampered by being effectively a fledgling, freely elected democratic government. This political status resembles emergent or less-developed economies more than the reality of having attained “Group of 20” status.
The African National Congress of Nelson Mandela has been in power all of fifteen years, since 1994 when the first free elections post-apartheid was held. For far too long, the history of South Africa has been marked by distrust among the indigenous Bantu, invading tribes from the north and east, the Dutch Calvinist Boers who came to stay, and the British who first wrested control of the country’s mineral wealth.
Though the Portuguese were the first Europeans to reach what they initially named the “Cape of Storms” (later, the “Cape of Good Hope”), it was the Dutch who established a permanent refreshment station nearly a century late, in 1652. From then on till 1994, the socio-political situation was predominantly one of the White interlopers pushing back the Blacks and Coloreds, subjugating and enslaving them.
For the most part, external developments and pressure paved the way to eventual accession by the African majority to self-rule. For example, it was the abolitionist sentiment in the home country that led to official bans on slavery within three decades of the British landing in the Cape Colony. But Blacks who had known no other life elected to stay with their former masters, albeit as “employees” paid largely in kind.
And the road forward remained rocky. Early in the 20th century, the White minority government passed the Native Lands Act, which not only placed severe restrictions on native ownership of land but also institutionalized segregation of the population. Blacks and Coloreds could work in the cities but they had to return to their assigned communities every evening and this was held as well for imported Chinese and Indian labor. Post-World War II, the National Party (that had never wanted to fight side by side with the British in the war) strengthened what became known as apartheid. Eventually, the combination of international sanctions and local resistance brought the Party to the negotiating table in 1990. Apartheid was repealed, a “Convention for a Democratic South Africa” commenced and free elections were held. Known worldwide for his long incarceration as a “prisoner of conscience,” Nelson came into power in 1994 and remains head of state till the present.
Socio-Economic Information
The diverse and often-explosive mix of peoples that is South Africa contrasts sharply with the homogenous people and culture of Japan. In addition, health status and income distribution heighten the differences in this country analysis.
South Africa has 11 official languages, all recognized in the constitution. English is common in official and business communication but there is also Afrikaans, Southern Ndebele, Northern and Southern Sotho, the Swazi and Zulu of the Zulus, Tsonga, Tswana, Vendam, and Xhosa. In contrast, Nippon has at most two dialects of the Japanese language and the indigenous darker people but these are a tiny minority. Virtually all Japanese (98.5%) belong to one common genetic stock (CIA, 2009a; 2009b).
South Africa has a sizeable White (9%), Indian/Asian (2%) and colored minorities (9%) against a backdrop of 80% Black population. As attested to by the different official languages, however, such “native” ethnicity is a veritable rainbow of many different tribes that have historically been at odds with each other (Bearak, 2008).
The UNDP rates Japan among the 38 nations that demonstrate “very high human development indices (HDI)” while consigning South Africa to the mediocre ranks of “medium human development” (2009a, p. 1; 2009b, p. 1). One very telling indicator of this is the GINI coefficient for income distribution. It is 38.1 (good to very good) in Japan, even better than the 46.3 recorded for the United States in 2007. In South Africa, in contrast, the 25% unemployment rate and low per-capita income for the country as a whole make for a worrisome GINI of 57.8 as of 2000 (Central Intelligence Agency, 2009b).
Among the reasons why Japan ranks 10th in the world in HDI as of 2007 is a very advanced and comprehensive health care system, on a par with those of the most advanced industrialized nations. Thus, both national and local governments pay for healthcare services, there is employer-paid health insurance, and those not so covered (including the elderly) can avail of the national health insurance program, all within the context of the universal health care insurance system. There is no such provision in South Africa where life expectancy at birth is dreadfully short at 49 years for males and 48 for women on account of communicable diseases that run rife: bacterial diarrhea, hepatitis A, and typhoid fever. Even worse, the plague of AIDS that is the scourge of sub-Saharan and East Africa also cuts an ominous swath through the population. After a long period when the Mandela government denied the prevalence of HIV, it has finally been revealed that up to 31% of pregnant women are HIV carriers and the annual infection ratio among sexually active adults stands at one in five as of 2005.
Summary
In the years following World War II, government-industry cooperation, a strong work ethic, mastery of high technology, and a comparatively small defense allocation (1% of GDP) helped Japan advance with extraordinary speed to the rank of the second most technologically powerful economy in the world after the US. Today, measured on a purchasing power parity (PPP) basis, Japan is the third-largest economy in the world after the US and China.
Two notable characteristics of the post-war economy were the close interlocking structures of manufacturers, suppliers, and distributors, known as keiretsu, and the guarantee of lifetime employment for a substantial portion of the urban labor force. Both features are now eroding under the dual pressures of global competition and domestic demographic change. Japan’s industrial sector is heavily dependent on imported raw materials and fuels. A tiny agricultural sector is highly subsidized and protected, with crop yields among the highest in the world. Usually, self-sufficient in rice, Japan imports about 60% of its food on a caloric basis. Japan maintains one of the world’s largest fishing fleets and accounts for nearly 15% of the global catch. For three decades, overall real economic growth had been spectacular – a 10% average in the 1960s, a 5% average in the 1970s, and a 4% average in the 1980s.
Growth slowed markedly in the 1990s, averaging just 1.7%, largely because of the after-effects of inefficient investment and an asset price bubble in the late 1980s that required a protracted period of time for firms to reduce excess debt, capital, and labor. In October 2007 Japan’s longest post-war period of economic expansion ended after 69 months and Japan entered into recession in 2008, with 2009 marking a return to near 0% interest rates. The 10-year privatization of Japan Post, which has functioned not only as of the national postal delivery system but also, through its banking and insurance facilities as Japan’s largest financial institution, was completed in October 2007, marking a major milestone in the process of structural reform. The Japanese financial sector was not heavily exposed to sub-prime mortgages or their derivative instruments and weathered the initial effect of the global credit crunch, but a sharp downturn in business investment and global demand for Japan’s exports in late 2008 pushed Japan further into a recession. Japan’s huge government debt, which totals 170% of GDP, and the aging of the population are two major long-run problems. Debate continues on the role of and effects of reform in restructuring the economy.
South Africa is a middle-income, emerging market with an abundant supply of natural resources; well-developed financial, legal, communications, energy, and transport sectors; a stock exchange that is 17th largest in the world; and modern infrastructure supporting an efficient distribution of goods to major urban centers throughout the region. Growth was robust from 2004 to 2008 as South Africa reaped the benefits of macroeconomic stability and a global commodities boom, but began to slow in the second half of 2008 due to the global financial crisis’ impact on commodity prices and demand. However, unemployment remains high and outdated infrastructure has constrained growth.
At the end of 2007, South Africa began to experience an electricity crisis because state power supplier Eskom suffered supply problems with aged plants, necessitating “load-shedding” cuts to residents and businesses in the major cities. Daunting economic problems remain from the apartheid era – especially poverty, lack of economic empowerment among the disadvantaged groups, and a shortage of public transportation. South African economic policy is fiscally conservative but pragmatic, focusing on controlling inflation, maintaining a budget surplus, and using state-owned enterprises to deliver basic services to low-income areas as a means to increase job growth and household income. CIA (online)
Economic Analysis
The Purpose of an Economic Analysis
In brief, the purpose of economic analysis is the aforementioned risk reduction and the need to protect investments in trans-border or overseas markets from unanticipated movements in the macroeconomic and political environments (Baye, 2008; Ajami, Cool, and Goddard, 2005). A side by side analysis of the economic conditions in the two countries is helpful in determining the extrinsic and intrinsic reasons for the two countries situation
Country Performance Indicators
Macro Performance: GDP, GNE, HFCE, Pop
GDP
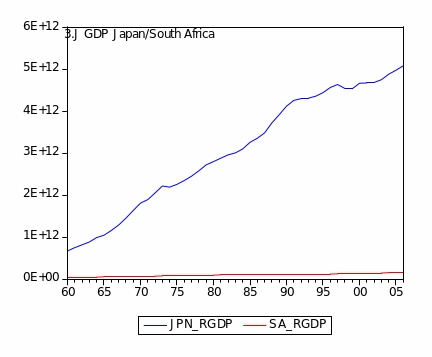
The Gross Domestic Product or GDP is the basic measurement of a country’s comprehensive economic performance. The GDP represents the net market value of all the goods and services made within a country over one year. A high GDP is suggestive of a high standard of living. However, the use of GDP as a stand-in for the standard of living has been questioned by some sectors. The GDP is also a good indicator of the overall market in a country. The most common method of computing the GDP is via the expenditure method which involves getting the sum of all private consumption, gross investments, government spending, and exports fewer imports.
The economy of Japan is the second-largest economy in the world with a nominal GDP of around $ 5 Trillion. In the 60s Japan’s GDP has grown at a steady clip of 10% annually. This went down to 5% in the 70s then 4% in the 80s before the onset of what would become a decade-long recession. From 1991-1999 GDP grew by a mere 1.5% in contrast to the rapid growth of the previous decades.
The 2008 GDP of South Africa is $277 billion or approximately 0.45% of the world economy. It is a two-tiered economy where one side is highly developed while the other contains mostly basic infrastructure. There exists a primary sector that is largely based on manufacturing, the services industry, mining, and large-scale agriculture. It s well developed. A secondary economy consisting of subsistence agriculture is poorly developed and usually excluded from economic measurements. The primary sector has contracted by 2.8% in the last two quarters as the worldwide recession grips South Africa.
A quick glance at the graph will indicate that the GDP of Japan is clearly much larger than that of South Africa. However, the GDP discrepancy is influenced by several factors. First, Japan has a much larger population than South Africa. This is a large human capital base on which a high standard of education has been invested. Given the higher level of industrialization, as well, it stands to reason that the country as a whole is more advanced and productive. Second, South Africa only recently, in the 90s, ended the practice of Apartheid which contributed to the slow growth of their real economy. Between the two countries, the largest export-based economy of South Africa is more vulnerable to the recession (World Economic Forum, 2009).
Gross Capital Expenditure
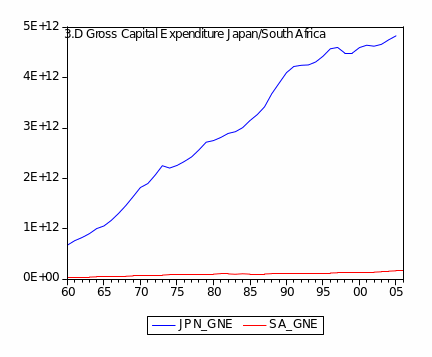
The Gross Capital Expenditure is a measure of the total capital the government spent in a country as reported to the proper government agency. The Gross Capital Expenditure of the two countries corresponds closely to the gross domestic product of the two countries. Japan’s GCF is much higher than that of South Africa because of the lower GDP base of South Africa. Nonetheless, it is possible to observe that average GCF expansion in South Africa came to 4.56% over the reference period. The gap with Japan could not be closed since, starting from a much higher base, successive Japanese governments saw an average annual GCF rise of 5.18%. Thus, the reasons for the discrepancy in GDP also apply to GCE.
Household Financial Consumption Expenditure
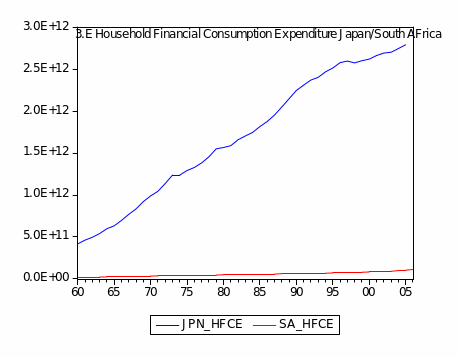
The Household Financial Consumption Expenditure is the measure of the total amount spent by all households in a country for a given year. The Household Financial Consumption Expenditure of Japan is significantly higher than its correlative in South Africa. This is in part due to the great disparity in per capita income between the two countries. Japan’s per capita income, at $34,115, is almost six times higher than South Africa’s ($5,684). Another influence is the consumerist culture of Japan where people are driven to obtain the latest in all things.
It can be noted that during the period between 1995 and 2000 Japanese HFCE stagnated as a response to the economic slowdown that Japan was suffering at that time. South African HFCE has been steady for the entire period. Furthermore, South African’s HFCE has been steadily growing since the 1960s.
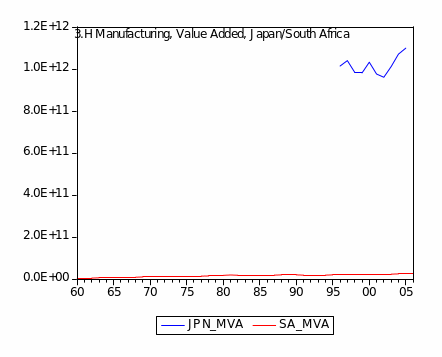
Sector Performance: Value Added: Agriculture, Industry, Manufacturing, and Services
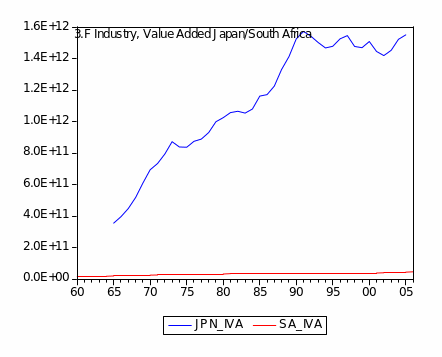
Trade Performance: Exports, Imports and Net Exports
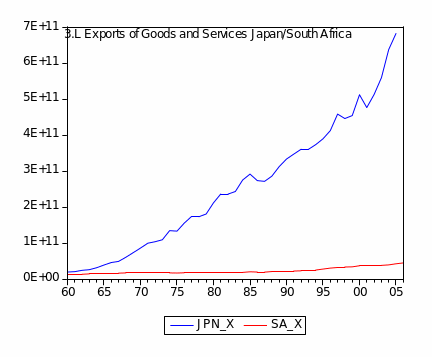
Japan’s exports are constant for the entire period covered, with minor dips. Between 2000 and 2005 Japan’s exports seemed to skyrocket. This is proof that Japan’s manufactured goods are still fit for export to other countries despite heavy competition from China. There is still a market for Japanese goods despite the availability of cheaper substitutes. However, the recession has harmed Japan’s total exports in recent years. South Africa’s chief exports, gold, and diamonds are always needed by the world hence even during economic downturns South Africa’s exports remain constant.
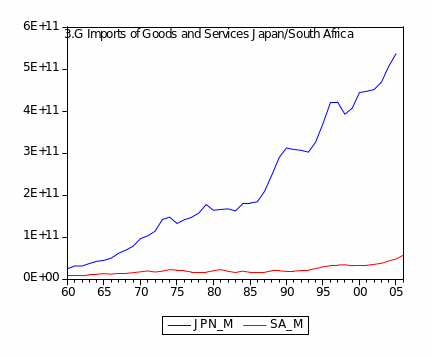
Japan lacks many of the natural resources it needs for its industries. Consequently, it has to import these from foreign countries. As a result, during periods of high economic activity Japan’s imports are also very high reflecting its need for raw materials. During periods of economic slowdown, imports are one of the first things to be cut back.
Investment: FDI and GCF
Foreign Direct Investment
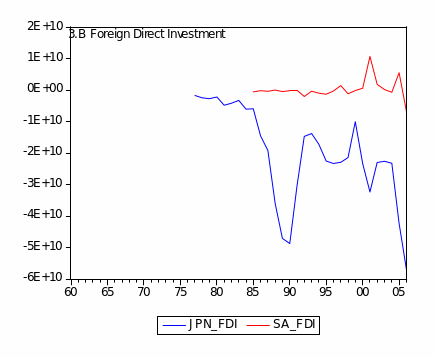
Foreign Direct Investment refers to foreign companies making physical investments in a given country. Commonly, this involves establishing a factory or a business in that country. Foreign Direct Investment is that mechanism of cross-border corporate control by which the foreign company gains control of assets in another country via its investment. A Foreign Direct Investment involves the parent company, usually a multinational corporation, setting up a branch in the country where the investment is being done. In order for an investment to qualify as a Foreign Direct Investment, the Parent firm must own a controlling interest in the local affiliate. Usually, a controlling interest is defined as 10% ownership.
Foreign Direct Investment in Japan is virtually non-existent while there is a modest FDI in South Africa.
The dynamics of the Japanese economy coupled with its relative lack of exploitable natural resources means that foreign companies are not likely to invest in Japan. For one, most natural resources in Japan are already being exploited by locally owned firms. Second, Japan has one of the highest labor costs in the world making any FDI in manufacturing highly unprofitable especially with China being so close by. Finally, the negative FDI also refers to Japan’s own Foreign Direct investment in other countries.
South Africa is the diamond capital of the world. The bans against South Africa due to its practice of Apartheid have only been recently lifted. Unlike Japan South Africa still has underdeveloped natural resources which can be exploited Central Intelligence Agency (2009b).
Gross Capital Formation
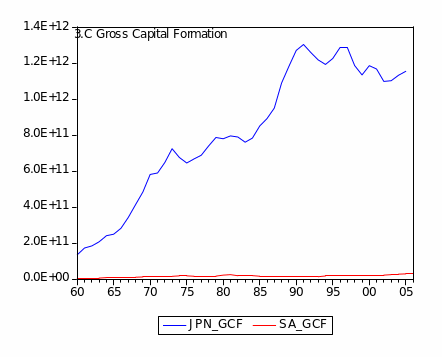
Gross Capital Formation is the measure of the total new investments in fixed capital assets within a domestic year. These investments can be made by corporations, governments, or even households. It is not a measure of total investment.
The lackluster GCF of South Africa is again a function of its small size economically when compared to Japan. Japan’s GCF has been fluctuating in pace with the world economy. For instance, it is noticeable GCF decreased during the long period of economic decline during the 1990s. It also declined during the period of worldwide economic decline during the 70s and early 80s when Oil prices skyrocketed. GCF appears to be sensitive to world economic conditions because Japan’s GCF declines during worldwide economic declines.
Summary
In current dollars, the Japanese economy is around twenty times the size of South Africa’s. The disparity in activity and wealth creation is accounted for partly by population size and the fact that industry and services are dominant in the Japanese economy. In contrast, South Africa is the archetype of a newly industrialized economy with many vestiges of its recent status as a developing nation. For one, it is as if there are two nations in the same tract of largely arid land: a highly industrialized sector that used high-value mines as a springboard for investment and the greater mass of blue-collar employees and subsistence farmers eking out an existence as best they can.
The Gross Capital Expenditure of the two countries moves in tandem with the GDP of the two countries. Setting aside the great disparity in starting size of the two economies, the last fifteen years or so have shown how external shocks and internal developments do impinge greatly on economic performance. The GDP and GCE of South Africa reveal the impact of transparency and renewed vitality after the Mandela government came into power. On the other hand, the bursting of the real estate speculative bubble centered around Tokyo dropped Japan into recession or deflation for more than a decade. By the time the economy recovered enough to post sustained expansion, the spillover effects of the current American recession (coupled with the staggering export performance of competitor China) dropped the Japanese economy into crisis once again and precipitated the end of the long-running Liberal Democratic Party monopoly on Japanese politics (Central Intelligence Agency, 2009a).
In point of generating the savings necessary for investment, the two nations also present contrasting pictures. For different reasons, the balance of payments was negative for both all throughout the reference period. Having a limited pool of exportable minerals, South Africa suffered from the balance of payments shortfalls and, when world opinion hardened, divestment by apartheid-conscious manufacturers and institutional investors. For its part, the trade surpluses for which Japan was famous were more than offset by a furious pace of investments outflows to open up other markets besides America and Europe.
On the other hand, both countries exhibited continuous growth in domestic GCF. At the start of the 1960s, it is true, the enormous savings rate of the thrifty Japanese meant that country could deploy 135 billion in 2000 dollars. This ratcheted up to $1.2 trillion by 2005. Nonetheless, the dynamism of the rapidly-industrializing South African economy showed itself in recovering to GCF’s last seen in 1980. By 2006, the marked improvement of the business climate in South Africa was evinced in a great spurt to just under $34 billion in GCF, thus closing the gap with Japan (Spulber, 2007; World Economic Forum, 2009).
Production and Resource Structure
Major Companies
Employing Spulber’s (2007) criterion of leading companies based on global competitiveness, the Japanese companies in just the top 100 of the most publicized compilation reveal the comparative advantage of that nation in automobiles, financial services, utilities, and global trading. They are Toyota (#3 in the 2009 Forbes Global 2,000 ranking), Mitsubishi UFJ Financial (#21), Nippon Telegraph & Telephone (#26), Honda Motor (#39), Sumitomo Mitsui Financial (#54), Mizuho Financial (#65, listed on the N.Y. Stock Exchange), Mitsubishi Corp. (#73, for the conglomerate’s network of international trading companies), Sony (#82), Nissan Motor (#88), Panasonic (#89), and Mitsui Co. (#97).
Banks, insurance, and telecommunications utilities also figure prominently in the roster of the largest South African companies by revenue. Demonstrating two important differences in the resource base of the two countries being analyzed, however, one sees the presence of the mining companies continuing to exploit the gold, diamond, uranium, and platinum riches of South Africa whereas coal is the only comparable natural resource in Japan. That hydrocarbon fuel has already fallen into disfavor in marked contrast to the start of the Industrial Age in Europe and America while continuing to appeal to cost-conscious emergent economies like India and China (no matter the carbon emission costs). Owing to its locational advantages, South Africa also maintains a thrust in oil exploration not only around the Cape of Good Hope but also the lucrative fields of east and west Africa. All in all, the scale of corporate revenue and these South African “industrial priorities”, if you will, bespeak the structure of the economy as still largely a newly industrializing nation whereas Japan Inc. is well and truly industrialized.
Thus, the major companies in South Africa are Standard Bank Group (#223 in the Global Ranking), Sasol (#305, in oil and gas operations), FirstRand (#332, banking), MTN Group (#382, telecommunications), Impala Platinum Holdings (#772, minerals), Telkom (#786, telecommunications), Gold Fields (#1097, minerals), Bidvest (#1102, holding company), Sanlam (#1142, insurance in a throwback to the British colonial experience), Remgro (#1220, holding company), Naspers (#1240, media), AngloGold Ashanti (#1408, minerals), Steinhoff Intl Holdings (#1461, consumer durables), ARM-African Rainbow Minerals (#1664, minerals), RMB Holdings (#1740, financial services), Shoprite Holdings (#1749, retail trade), and Harmony Gold Mining (#1958, minerals) (Forbes.com, 2009).
Major Resources
Being an archipelago, Japan counts fish from the surrounding seas as its most abundant resource these days. Agriculture, principally rice, has essentially vanished owing to the inroads of manufacturing. There is significant forest land but timber production does not even suffice for domestic needs. Lacking no energy resources of its own, the country is the single biggest importer of coal and natural gas, besides being the second largest global market (after the United States) of crude oil (Spulber, 2007; Central Intelligence Agency, 2009a).
In contrast, South Africa is rich in the aforementioned mineral resources and even land. This largely arid land contains the largest deposits of gold and platinum in the world. The DeBeers S.A. diamond monopoly and global wholesaler nominally maintains the official Exchange in Luxembourg and head office in London but its resource base is really in Kimberley and Namibia. Fourth, South Africa extracts enough coal to export. Finally, subsistence farming and the great family-owned plantations producing citrus and other fruits, corn, wheat, dairy products, sugarcane, tobacco, wine and wool may contribute a minimal 3.4 percent of GDP (World Factbook, 2009) but the fact is that South Africa is a net exporter. It is just that the volumes are overshadowed by the stratospheric value of gold and platinum shipments.
Competitive and Human Capital Advantages
Absent any significant natural resources that can be used as a base for industrialization, the success of Japan Inc. rests on the combination of a highly literate people, cultural homogeneity and unity behind the Emperor, hardnosed management systems, and cooperation between the government and the zaibatsu (the old-line industrial conglomerates). The literacy rate stands at 99%, counting even the 5 million ethnic and immigrant minorities: Koreans, Chinese, Okinawans, and the Ainu aboriginals. Religion-wise, there are Shinto and Buddhism but inter-religious conflict is subsumed in an unmatched unity of obedience to the divinity of their Emperor, said to be descended from the Sun God Amaterasu in eons past.
Such social phenomena have their parallels in the business world where consensus is the rule and workers used to be able to count on lifetime employment. Though the ravages of a decade-long recession diluted this paternalism, economic difficulties do not detract from the successes attributed to just-in-time supply chain management, total quality management, the extremely patient practice of kaizen or continuous improvement of products over years and decades until they provide greater value and functionality than American and European (Spulber, 2007; Central Intelligence Agency, 2009a).
Both countries in this analysis had their share of social upheavals in recent history but Japan had a five-decade head start on achieving peace, order and stability. Between 1945, when Japan officially surrendered, and 1952, the American occupation government contributed, among other things, the democratization of political institutions along the U.S. model. Thereafter, the Japanese were left to their own devices for reconstruction and building the basis for export-led success. By the start of the reference period in this analysis, manufactured exports already counted consumer goods and heavy machinery.
In two more decades, the unique partnership between industrial conglomerates and the Japanese Ministry of International Trade and Industry had succeeded in penetrating and toppling the U.S. lead in electronic components, television sets, other home appliances, and cars. In South Africa, by contrast, there was a long gap of eight and a half decades between winning independence from Great Britain and majority rule under President Mandela in 1994. During that interval, suppression of Black and Colored rights persisted and so did the social unrest in protest of apartheid (Spulber, 2007; Central Intelligence Agency, 2009a; 2009b).
Nonetheless, the White minority had long laid the basis for industrialization. Commencing with gold refining, South Africa transitioned to producing ferroalloys, stainless steel and other metal products, railway cars, import-substituting synthetic fuels, equipment and machinery for mining, and even weaponry when the trade embargoes protesting apartheid were at their height (Spulber, 2007; Central Intelligence Agency, 2009b).
Post-1994, the Mandela and Zuma governments gradually diminished the overwhelming role of government in industry and commerce, moved away from the tariff barriers and subsidies designed to protect import-substituting industries, encouraged investments with liberalized foreign exchange controls and tax cuts on dividends (Spulber, 2007; Central Intelligence Agency, 2009b).
The budget for education was run up to 5.4% of GDP as of 2006. In absolute dollar terms, this ranked 53rd in the world. And the thirst for education, together with the infrastructure to slake it, has resulted in a high average schooling of 13 years. Still, the nation has a way to go to stand on even footing with the most advanced industrial nations. Based on the population 15+ years that can read and write, the admitted literacy rate stood at 86.4 % as of 2004, 15 percent lower than that achieved by Japan.
What they actually read and write is another story since South Africa is such fractured herding of diverse natives, colonials, and immigrants from even more impoverished neighbors in centuries past. According to the 2001 census, just one in twelve reports English as their primary language. The rest of the people is segmented almost equally into IsiZulu (23.8%), IsiXhosa (17.6%), the Afrikaans developed by the Dutch colonizers (13.3%), Sepedi (9.4%), Setswana (8.2%), Sesotho (7.9%), and many others (Central Intelligence Agency, 2009b).
Locational Advantages
Residing in a mountainous archipelago, the Japanese took to fishing and sea transport out of necessity. In the long run, the location of Nippon in the Northwest Pacific gave the Japanese the twin advantages of proximity to the East Asian producers of food, metals, rubber and gold for modern use in semiconductors and the reasonably short “Great Circle Route” to the primary export market that is America (Spulber, 2007; Central Intelligence Agency, 2009a).
Until precious metals and diamonds were discovered, the location of South Africa mattered solely as a revictualing point for merchant vessels of European empires on their way to the rich resources of India and the Far East. In modern times, the country can parlay location at the midpoint between Persian Gulf oil producers and Europe’s markets to offload and refine the cargoes of deep-draft tankers that cannot transit the Suez Canal. Proximity to the developing nations of sub-Saharan Africa also offers some advantages for overland shipment of refined petroleum products and manufactured exports (Spulber, 2007; Central Intelligence Agency, 2009b).
Summary
Critical Strengths and Opportunities
The manufacturing base of both nations is the critical underlying strength for both. The opportunities for the medium term owing to the degree of sophistication already achieved and to competition from other nations.
Japan has already seen its lead in consumer electronics overtaken by China and Korea. Both are catalyzed by the relative proximity of the lucrative North American market. Next, the Japanese automotive industry has already suffered inroads by Korean brands like Hyundai and Kia. China already has models doing well in their domestic market and it is only a matter of time before they test the waters with exports to other Asian markets and, subsequently, North America.
With one sector vanquished and the crown jewel of automobiles under threat soon, Japan would do well to emulate the U.S. and move forward vigorously on high-technology industries. As well, the country has to leverage the strength of the yen and the global standing of its very large banks to gain a fair share of sophisticated financial markets as the U.S. and the U.K. have done.
While South Africa also felt the effect of the “global” recession that originated in America, that country has not recently been vulnerable to the long downturn that afflicted Japan. Even as the new government has already had fifteen years to initiate and nurture market-oriented reforms, the opportunity remains to more fully develop an industrial base to bring down unemployment and cater to proximate markets in competition with the industrialized leaders in Europe. For instance, the nation has the capability of “exporting” financial services to the rest of Africa, apart from the fact that the South African stock market is already in the global top 20. Perhaps more could be done to supply refined petroleum products to Central African markets through what is already an efficient infrastructure network. After all, banditry and tribal conflict have made the Nigerian counterpart inefficient and costly.
Literacy and educational attainment not far removed from Japan’s could enable South Africa to broaden the base of the services sector. Outsourced business process services for European and North American clients and healthcare for the rest of AIDS-ravaged Africa look to have bright prospects.
Critical Weaknesses
Export-led growth has carried Japan a long way and, ceteris paribus, the long-term trend (see section 5.3 below) might justify GDP growth of between 4% to 5% per annum. The downside of creating wealth by overseas trading is that Japan became vulnerable to external shocks. When a succession of OPEC-engineered crude price increases came on the scene, the increased energy costs of Japanese industry and the collapse of American markets essentially ended the era of double-digit economic growth. Fiscal policy would therefore do well to become more inward-looking by, for example, spurring domestic demand.
The sustained focus on export-led manufactures encouraged education for employment in those businesses. Being built as well on loans with favorable terms, the export drive propelled the growth of the financial sector. Other service sectors were essentially neglected, however. Today, the “graying” of Japan spotlights inadequate manpower in healthcare, thus putting that country in the same position as the United States: having to import the necessary professionals.
Before South Africa can play a larger role in the region, that nation needs to develop beyond the present base of light industry. Broader participatory democracy already all of 15 years old has yet to achieve energy self-sufficiency and the broader base of industries or services that will not only resolve significant unemployment but also reduce tribal frictions. Only then can South Africa proceed to the kind of outward-looking, export-led growth that was the hallmark of Japanese success in the latter half of the last century.
Univariate of Forecast of GDP
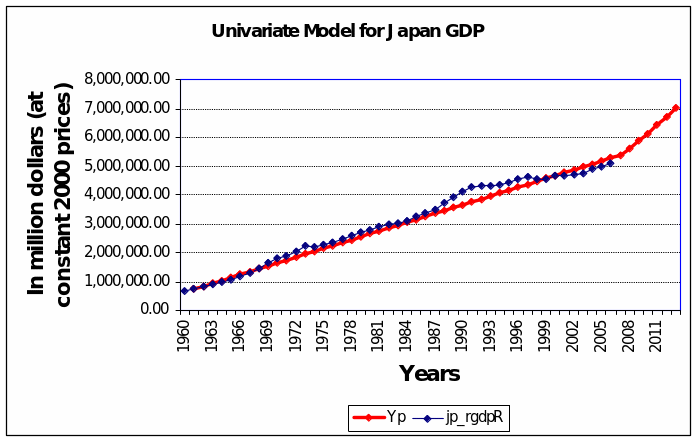
Accounting solely for a time as the explanatory variable, the univariate model for Japan GDP would predict 98% of the variance in annual GDP (r2 = 0.98), yield an intercept of -$197 billion, a beta coefficient of around $101 billion (all in constant 2000 U.S. dollars) and predict average annual growth of 4.5% in the near term, till 2012 (see Figure 10 overleaf). The model predicts GDP reaching $7 trillion in 2012.
This is a vigorous spurt compared to the 0.2% to 2.7% annual growth seen since the turn of the century and is accounted for largely by the remarkable 4.7% to 12.9% Japan managed early in the reference period. After 1973, however, the OPEC response to losing the Yom Kippur war quadrupled the price of crude oil, began serious volatility in the price of that important input for industrialized economies, and ended the era of cheap energy forever.
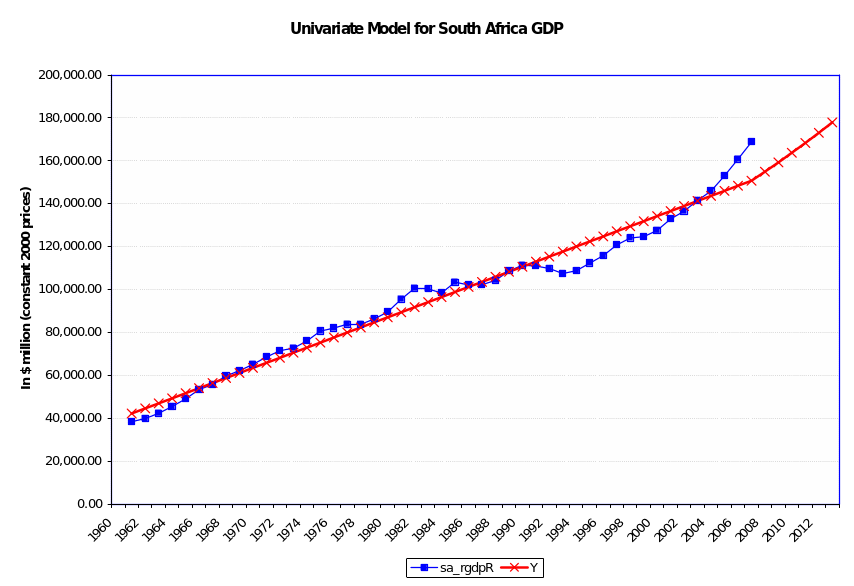
For South Africa (Figure 11 overleaf), the model accounts for a minimally lower 96.9% of the variance in annual GDP (r2 = 0.9688), an intercept of about $45 billion dollars, a beta coefficient of around $ 2.4 billion (all in constant 2000 U.S. dollars) and predicts average annual growth of 2.81% in the near term, till 2012. All things considered, the outlook is for attaining a GDP of $177.8 billion (in current 2000 values) by 2012.
Summary
Over the next few years, the fundamental strengths and comparative advantage of Japan vis-à-vis South Africa give credence to the above simple univariate prediction of GDP for the former continuing to expand at double the rate for South Africa.
References
Ajami, R. A., Cool, K. & Goddard, G. J. (2005). International business: Theory and practice. Armonk, NY: M. E. Sharpe, Inc.
Baye, M. (2008). Managerial economics and business strategy. New York: McGraw-Hill Irwin.
Bearak, B. (2008). Immigrants fleeing fury of South African mobs. New York Times.
Central Intelligence Agency (2009). The World Factbook: Japan. Web.
Central Intelligence Agency (2009). The World Factbook: South Africa. Web.
Economist Intelligence Unit (2008). Country analysis and forecasts. Web.
Forbes.com (2009). Forbes 2000: Search results. Web.
Spulber, D. (2007). Global competitive strategy. Cambridge: Cambridge University Press.
UNDP (2009). Statistics of the Human Development Report – Japan. Web.
UNDP (2009). Statistics of the Human Development Report – South Africa. Web.
Voice of America (2009). Obama, Hatoyama emphasize cooperation during Tokyo visit. Web.
The World Bank (2008). World development indicators.
World Economic Forum (2009). Global competitiveness report: 2009-2010. Web.
