Executive Summary
Valuation of a business entity can be undertaken using a number of different approaches. In addition, a single business can be valued using more than one method. The various methods focus on different aspects and attributes of a company. Consequently, using varying valuation strategies provides a more comprehensive value of the business compared to the use of a single approach.
The following report establishes the value of JD Sports Fashion Plc. The assessment is based on three different methods of business valuation. The report explains the aspects of the firm taken into consideration under each approach. In addition, the various assumptions made under each method are highlighted. Ultimately, the report establishes the actual value of the business. In addition, recommendations on how to maximise the value of JD Sports Fashion Plc are made.
Section 1: Company and Industry Overview
JD Sports Fashion Plc.: A Synopsis of the Organisation and its Position in the Apparel Industry
JD Sports Fashion Plc. was established in North West England in 1981. It was started as a single store (Annual report & accounts 2013). The company is a leading retailer and distributor of fashion apparels, which are inspired by athletics and sports (Annual report & accounts 2013). JD Sports also deals with outdoor clothing, footwear, and other similar equipment. The company has its headquarters in Bury, Great Manchester, in England. It has stores in different parts of the United Kingdom. Several of the outlets are located in Ireland.
Currently, most operations of JD Sports Fashion Plc. are centred in Europe. In addition, the retailer operates stores under different brands, making up a group of outlets in different parts of the continent. Consequently, the entity has more than 800 stores that operate under various fascias in various countries (Annual report & accounts 2013). The retail fascias making up the company are found in the UK, France, Spain, and the Republic of Ireland.
Apart from the physical stores, the group hosts online operations for its retail fascias. The company provides customers with a multichannel and international transaction platform. JD Sports Fashion Plc. is listed in the London Stock Exchange under FTSE 25 Index (Annual report & accounts 2013). It is also noted that 45% of the company is owned by Pentland Group.
JD Sports Fashion Group is made up of JD, Scotts, Size?, Bank, and Chausport (Annual report & accounts 2013). Millets, Blacks, Champion, Tessuti, Ark, Sprinter, and Cloggs constitute other fascias of the group. Some of the brands sold in the group’s retail outlets include Nike, Adidas, Fila, and Levi’s. Other famous sports brands distributed by the entity include Carbrini, Umbro, Puma, Playboy, and Reebok (Annual report & accounts 2013). As such, JD Sports Plc. is a subsidiary of the Group JD Sports.
JD Sports Fashion Plc. is one of the best performing companies in the sports apparel industry in Europe. The trend is reflected in the firm’s stock price and diversity in the market. For instance, the company was trading at 7.5 x P/E in 2011 (Annual report & accounts 2013). In addition, the firm has recorded a free float over time. The situation is an indication of positive stock returns in the near future.
Figure 1 below indicates the company’s consensus estimates between 2009 and 2012:
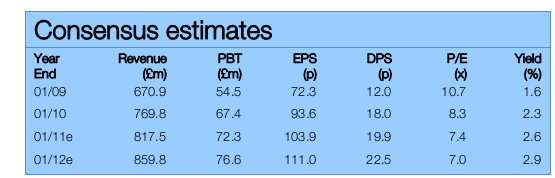
JD Sports has managed to take advantage of the emerging trend where people wear clothing brands that are sports oriented, making them part of their everyday fashion. The trend is especially common among youthful consumers. The introduction of new brands and acquisition of established firms attest to the company’s prominence in the industry.
JD Sports Fashion Plc.’s Capital Structure
JD Sports is a publicly traded company. As a result, it is financed through both equity and debt. The comprehensive balance sheet of the entity provides an elaborate view of its capital structure. The company’s statement of financial position as at February 2, 2013 is shown in the appendix.
The bulk of JD Sports Plc.’s equity is generated from the shareholders of the parent group. An analysis of the comprehensive balance sheet illustrated above indicates that the finance used by the company originates from issuance of ordinary shares. Other sources of capital include premiums and retained earnings. The entity is rarely financed through loans as is made clear in the statement of financial position as at 2 February, 2013 (Annual report & accounts 2013).
Section 2: Valuation of Business Organisations
An Overview of Business Valuation Methodologies
Business enterprises can be valued using different categories of valuation methodologies. The categories include asset approach, income method, and market methodology (Bailey et al. 2008; West & Jones 1999). Each of the different methods utilises a unique approach and attributes to determine the value of a particular business entity.
Business valuation using the asset approach
The approach is used to value a business by analysing the ‘underlying’ assets owned by that particular organisation (Damodaran 2012). The assets are used in estimating the actual value of the overall business undertaking. Basically, the approach relies on the economic principle of substitution (Bailey et al. 2008). The party undertaking the valuation process estimates the costs that can re-create a business with an equal economic utility (Damodaran 2012). The said utility implies a business that can produce the same amount of returns to owners as the subject entity.
The asset approach can be undertaken using two different methods. The methods include asset accumulation (net asset valuation) and capitalised excess earnings technique [liquidation value] (Damodaran 2012).
Market approach to business valuation
The approach entails analysing the market within which the business is operating in order to determine indicators of the enterprise’s value (Ross, Westerfield & Jaffee 2005). In most cases, the worth of similar business is reviewed. Comparative data is collected and then utilised to estimate the value of the subject business firm (Chandra 2008).
The market approach to business valuation relies on the economic principle of competition (Chandra 2008). The principle seeks to establish an estimate value of the business in relation to similar enterprises whose worth in the market has been recently established (Brealey, Myers & Marcus 2012). Two methods of analysis are utilised under the market approach (West & Jones 1999). One of them is the comparative publicly traded transaction method. The other is the comparative publicly traded company transaction method.
Income approach to business valuation
The approach is based on the popular economic principle of expectation. It uses this standard to determine the value of the business entity in question (Brealey et al. 2012). The approach estimates future returns that the business owners can expect to generate from the enterprise. The returns are then compared to the comprehensive associated risk (West & Jones 1999). The associated risk entails the threat related to full and timely realisation of the returns.
Expected returns can either be considered as single value or as a stream of income that the business owners expect to receive in future from the enterprise (Chandra 2008). The risk is quantified through discount rates of capitalisation. According to Brealey et al. (2012), the two methods rely on a single measure of enterprise earnings, which is referred to as the direct capitalisation strategy. The approaches relying on a stream of income are referred to as discounting methods (West & Jones 1999).
Discounting methods directly establish the time value of money. Consequently, they are used to determine the present value of the business and projected income stream. Strategies used under the income approach include the discounted cash flow, capitalisation of earnings, and multiple of discretionary earnings (Chandra 2008).
Three methods under this approach will be used in the valuation of JD Sports Fashion Plc. They include net asset valuation, discounted cash flow, and the dividend discount model.
Valuing JD Sports Fashion Plc. Using the Net Asset Method
Basically, the net asset value of a business is the difference between total assets and total liabilities (Ross et al. 2005). Under this method, the values of assets and liabilities held by the firm are determined individually (West & Jones 1999). An assumption is made to the effect that assets are disposed of in an orderly manner.
The proceeds made from the orderly disposal of assets are used to settle all liabilities. They are also used to cover for the taxes arising from the gains made from the clearance. According to Brealey et al. (2012), calculated equity value is arrived at by deducting the value of total liabilities from that of total assets. In addition, taxes resulting from the proceeds made from disposing the total assets are deducted. West and Jones (1999) provide a working definition of net assets value. According to West and Jones (1999), the term refers to the value of assets that can be availed to the ordinary stakeholders. The value of the stakeholders is ascertained after deductions of preference capital, loan capital, and debts of concern are made.
According to Brealey et al. (2012), the net asset valuation approach is commonly used in ascertaining profitability, creditworthiness, and solvency of a business. In situations where liabilities exceed assets, the value is negative. Consequently, the enterprise is regarded as insolvent. The table below indicates JD Sports total assets and liabilities as at 2 February, 2013:
Table 2: JD Sports Fashion Plc.’s total assets and liabilities as at 2 February, 2013.
Based on the calculations made above, it is apparent that the net book value of JD Sports Fashion Plc. is approximately £266m. However, this method of determining the value of JD Sports has various shortcomings, making it unreliable. For instance, it does not establish the equity discount rate that can be used to establish JD Sports’ cost of capital. In addition, the method does not put into consideration the future value of the business (Ross et al. 2005).
Valuing JD Sports Fashion Plc. using the Dividend Discount Model
The method makes use of income to determine the value of a business firm. It relies on the stock price of the subject business from the perspective of projected dividends (Brealey et al. 2012). According to Brealey et al. (2012), the present value of the predicted dividends is determined by discounting them back. Several approaches can be used to value an enterprise based on the dividend discount model. However, it is important to note that the approach is not applicable to companies that do not issue dividends to their shareholders.
JD Sports’ proposed payable dividend price for the 2013 operating period is £26.30 (Annual report & accounts 2013). The figure is up from £22.00 per ordinary share in 2012. Furthermore, the total payable dividends for the year increased by 4% (Annual report & accounts 2013). The figure indicates a cumulative growth of 209% for the last 5 years (Annual report & accounts 2013).
In essence, the discount model seeks to determine the growth rate of JD Sports’ dividends. The trend is used to ascertain the worth of the business firm. Return on Equity (ROE) value is usually multiplied by the retention ratio which is usually one to every payout [1-payout] (Brealey et al. 2012).
According to Brealey et al. (2012), the share value is determined by establishing the present worth of the company’s future returns. The established figure is referred to as the intrinsic share value. The intrinsic share value for JD Sports is calculated using the following formula:
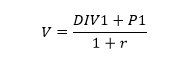
Where:
V= JD Sports’ intrinsic share value.
r=expected rate of return.
DIV1=Expected dividend in 1 year.
P1=Expected share price in 1 year (West & Jones 1999).
The approach assumes that the average growth rate of JD Sports Fashion Plc. remains at 4%. In addition, dividends for the following year are estimated to be worth £27.35. On the other hand, the expected rate of return is fixed at 15% on the basis of cost of equity. The expected share price in one year can be established using the previous year’s figures. Present share value for JD Sports Fashion Plc. stands at £403.
As such, the intrinsic share price for JD Sports Fashion Plc.:
![]()
As at February 2013, JD Sports issued 48,661,658 ordinary shares (Annual report & accounts 2013). Since then, the company has not made any changes. Based on this, the company’s worth is:
(£374* 48 661 658 shares) = £18199 m.
According to Brealey et al. (2012), the intrinsic value of share is reasonable since it covers opportunity costs that may be incurred by the investors. The calculated value of JD Sports Fashion Plc. is the company’s market capitalisation. The figure is derived from the shares on offer.
Table 3: JD Sports’ shares as at February 2, 2013.
Valuing JD Sports Fashion Plc. using the discounted cash flows (DCF) method
Overview
According to Brealey et al. (2012), discounted cash flows method is one of the most accurate estimates of the value of an enterprise. It uses the earning potential of the entity to determine its worth. The method establishes the value of a firm by discounting its future earnings (Fernandez 2007). Discount rate is utilised to illustrate the potential risks of JD Sports.
Three inputs are needed in the computation of the discounted cash flows. The first is the net cash flow. The value is projected over a pre-determined duration in the future. The second input is the discount rate. Ultimately, the long-term residual value of JD Sports is established.
According to Fernandez (2007), discount rate highlights the risks faced by the subject firm. West and Jones (1999) postulate that discounted cash flow method establishes the present value of a firm based on projections of the returns expected from the entity. The logic behind this method is anchored on the assumption that an enterprise is worth the amount that it has the capability of availing to investors in the future (Brealey et al. 2012).
Discounted cash flows approach uses several methods to determine the value of a business (Peck & Temple 2002). The strategies include free cash flow to equity and the dividend discount model (Nangia, Agrawal & Reddy 2011). The other method under this approach is cash flow to firm approach. The free cash flow to equity approach is utilised in the valuation of JD Sports Fashion Plc.
Forecasting growth in revenues over a projected period of time
DCF method requires the cash flows of the business under review to be projected over a given duration in the future (West & Jones 1999). According to Brealey et al. (2012), extrapolating the cash flows over a period of five years gives a reasonable value. Consequently, JD Sports Fashion Plc.’s cash flows are reviewed five years into the future in order to attain this worth.
The five year projection is based on the assumption that the operations of the company are perpetual. As such, the company is expected to be in operation even after the duration. Other expectations under the assumption include stiff competition that may affect the future operations of the entity and other influences from the external environment.
Determination of JD Sports Plc. revenue growth
Between 2009 and 2013, JD Sports recorded a consistent positive growth in revenues. The figure below illustrates this situation clearly:
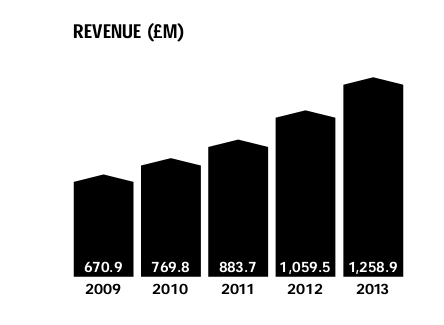
The rate of growth with regards to revenues is determined by projecting them over a specified duration of time. In this case, the duration is five years (Brealey et al. 2012). The growth rate is a product of various functions. The elements include projected capital expenditure and operating profits after tax (Nangia et al. 2011). The other function is the capital needed to support the operations of the business.
The base year for JD Sports’ calculations is the one ending 2 February, 2013. The revenues for this period add up to £1258.9m (Annual report & accounts 2013). On the other hand, revenues for the year ending 28 January, 2012 were 1 059.5m. The figure is an increase of 18.8%. Based on this change, one can assume that revenues will register a positive constant growth of 18% for subsequent years.
In most cases, numerous environmental factors influence growth in revenues. After taking into consideration such occurrences in the projections, it is assumed that revenues will grow by 18% for the first two years. However, the growth will drop to 15% for the remaining 3 years. Based on the most recent revenues registered by the company, the growth rate can be projected as follows:
Table 3: Optimistic and realistic revenue growth rates for JD Smith.
Source: Annual report & accounts (2013)
Forecasting JD Sports Fashion Plc.’s free cash flows
According to Fernandez (2007), free cash flows refer to the amount of cash available in the organisation. It is the amount left after deduction of all expenses over the forecast duration is made. In essence, the flow entails the funds remaining from the operations of the business. It can be used for investment.
Free cash flows are determined using the revenues remaining in the enterprise after factoring in working capital and operating costs requirements (Brealey et al. 2012). Other deductions included here involve taxes and net investments. However, non-cash expenses, such as amortisation, are not deducted (Peck & Temple 2002).
The current working expenditure is used to compute the future operating costs of the subject business. As such, operating costs margin for JD Sports Fashion Plc. will be used for these purposes. The costs for the 2013 period were £1217650, which is approximately £1217m (Annual report & accounts 2013). Operating margins are computed by assessing the operating costs in relation to generated income.
Operating costs are determined as follows:
![]() .
.
The operating margin implies that for every £1 of revenues earned by JD Sports Fashion Plc., the company incurs £0.97 in operating expenses. Assumptions based on realistic values for the projected duration must be made. In this case, a realistic assumption is that the operating costs of the company increase due to lowered competition. Consequently, it is expected that operating costs will remain at 96% for the first three projected years. However, the margins will increase to 98% in the subsequent two years. Table 4 indicates the projected results.
Some of the main suppositions made in the calculation include:
- The company pays tax at the rate of 24%. In addition, the entity will pay at the same rate over the projected duration.
- Net investments for JD Sports Plc. in the last two years stood at 20%.
- Competition will increase and the firm will need to make additional investments. Investments are spread over the projected duration as follows:
18% for the next 3 years and 20% for the last 2 years
Table 5: Operating functions for JD Sports.
Working capital is what remains after current assets are deducted from current liabilities. Fernandez (2007) argues that sales revenues generated by a business are directly proportional to the working capital. The case is similar for JD Sports Fashion Plc. By deducting current liabilities from current assets, the net working capital stands at £127m.
Free cash flows for JD Sports are calculated as shown in Table 6 below:
Table 6: JD Sports’ free cash flows forecast.
It is important to determine the discount rate after establishing the cash flows. The discount rates are needed to find the net present values for the entity (Ma, Whidbee & Zhang 2011). The weighted average cost of capital (WACC) can be used for these purposes (West & Jones 1999).
According to West and Jones (1999), WACC is computed using the following formula:
WACC= Re x E/V + Rd x (1 – corporate tax rate) x D/V.
Where:
Re= cots of equity.
E/V= company’s equity in relation to the total value (equity+debt).
D/V= proportion of debt in relation to total value.
Rd= borrowing rate on company’s debt.
Based on the above, JD Sports’ WACC can be calculated as follows:
An assumption can be made that the company’s capital is 70% equity and 30% debt and tax rate remains at 24%. In addition, debt can be assumed to be 5%. A risk free rate of 4.0% will be used in the calculation. Other assumptions include a risk premium of 8.0%, cost of equity of 7.0%, and a beta of 1.2.
Consequently, WACC=
Cost of debt 0.30[Rd*(1-0.24)] +1.2=
0.30*[3.0*0.5] +0.30[3.5] +1.20=5.45.
+
Cost of Equity 0.70[Rf+ b (RP)]
0.70 [0.5+1.2(8)] = 7.07.
WACC=13%.
The next step involves establishing the terminal value. The figure will be used to determine the value of the company. According to Nangia et al. (2011), terminal value is computed using the following formula:
![]()
If one assumes that JD Sports’ cash flows exhibit an annual growth rate of 4%, then the value of the company can be calculated as follows:
![]()
Under the discounted cash flows method, JD Sports Fashion Plc is worth £1005m.
Future Maximisation of JD Sports’ Value
JD Sports Fashion Plc. is engaged actively in acquisitions and mergers (Annual report & accounts 2013). Given the expansion strategy adopted by the company, the value addition tactics suggested in this report will prove to be effective. The organisation can boost its value further by exploring the apparel industries found outside the European market. The competition in Europe is very high. The company can also strengthen its position in new markets by acquiring established outlets in these frontiers.
Conclusion
In this report, the various methods of valuing a business were analysed. Three approaches were used to determine the value of JD Sports Fashion Plc. All three gave different figures. However, the discrepancies do not imply inaccuracies on the part of the approaches used.
Each business valuing method utilises on a number of factors to determine the worth of an enterprise. For instance, the asset valuation approach relies heavily on the present value of the company’s tangible assets. The discounted cash flows method, on the other hand, uses the future ability of the company to generate revenues. Combination of different methods provides a comprehensive value of the business. The figure can be used to determine the price of the enterprise.
References
Annual report & accounts 2013. Web.
Bailey, P, Brown, P, Potter, M, & Wells, P 2008, ‘A practical comparison of firm valuation models: cash flow, dividend and income’, The Finsia Journal of Applied Finance, vol. 2, pp. 22-28.
Brealey, R, Myers, S & Marcus, A 2012, Fundamentals of corporate finance, 7th edn, McGraw Hill, New York.
Chandra, P 2008, Financial management: theory and practice, Tata McGraw-Hill, New Delhi.
Damodaran, A 2012, Investment valuation: tools and techniques for determining the value of any asset, 3rd edn, Wiley, New York.
Fernandez, P 2007, ‘Valuing companies by cash flow discounting: ten methods and nine theories’, Managerial Finance, vol. 33 no. 11, pp. 853-876.
Ma, Q, Whidbee, D & Zhang, A 2011, ‘Value, valuation, and the long-run performance of merged firms’, Journal of Corporate Finance, vol. 17 no. 1, pp. 1-17.
Nangia, V, Agrawal, R & Reddy, K 2011, ‘Business valuation: modeling forecasting hurdle rate’, Asian Journal of Finance & Accounting, vol. 3 no. 1, pp. 86-102.
Peck, S & Temple, P 2002, Mergers and acquisitions: critical perspectives on business and management, Routledge, London.
Ross, S, Westerfield, R & Jaffee, J 2005, Corporate finance, 7th edn, Tata McGraw-Hill, New Delhi.
West, T & Jones, J 1999, Handbook of business valuation, 2nd edn, Wiley, New York, NY.
Appendix
Appendix 1: JD Sports Fashion Plc.’s statement of financial position.