Executive Summary
Hamdan Footwear is a start-up company, planned to start operating in June 2015. The demand for shoe in the United Arab Emirates is constantly rising owing to the changing lifestyle and increased urban population. The company will be a semi-mechanized footwear production unit, which will focus on producing affordable footwear for ladies. The footwear will include sandals, sleepers and rubber shoes. The footwear will be sold directly to wholesalers and retail outlets in Abu Dhabi and other cities within the UAE. The target market already has similar established units. The production capacity will be around 800 pair of shoes daily of which 60 percent will constitute sandals and sleeper, while the rest will be rubber shoes. Sandals and sleepers will be sold at 100 AED per pair, while the rubber shoes will be sold at 80 AED per pair. The initial capacity will be 50 percent (400 pairs per day), while the optimal capacity will be 80 percent (640 pairs per day). The optimal capacity will be achieved in the fourth year. This means there will be a 10 percent increase in the production capacity each year. This production capacity is deemed financially feasible and validates the capital outlay, as well as the costs of operation. In addition, the owners extensive knowledge and experience in the footwear industry, excellent quality of shoes, striking designs, reasonable pricing and strong market connection are the main elements of success for this company. The company will position itself as an exceptional service provider. Sales revenue in the first year is projected at around 7392000 AED. The revenue is expected to go up to 15259200 AED by the third year. Hamdan Footwear will be managed by working partners. The number will be 5 partners in the beginning. The company expects to make a return of roughly 7000000 AED in the first year, with over 80 percent level of production. The company will be financed for start-up through owners’ contribution.
Business Information
Business History
Hamdan Footwear is a start-up company situated on Hamdan Street, Abu Dhabi. The company will start operating on June 2015. The company will be a semi-mechanized footwear production unit, which will focus on producing affordable footwear for ladies. The footwear will include sandals, sleepers and rubber shoes. The footwear will be sold directly to wholesalers and retail outlets within the target market. In addition, the footwear will be under the company’s brand name. The owners of Hamdan Footwear have a long history together, dating back to when they were working for a local footwear company as shoe designers. In the early 2015, they seized an opportunity to come together and form their own company.
Mission and Vision
The Hamdan Footwear’s mission is to be the top brand and manufacture of stylish ladies shoes in Abu Dhabi and the entire UAE. By setting up an up market, retail presence in Abu Dhabi, that act as a complementary for the wholesale distribution and maximizing operational processes to reduce costs and time wastage, Hamdan Footwear aspires to control its target market. The company’s long-run vision is to be known for exceptional, trend-setting ladies footwear and to increase its presence across the region.
Key Initiative and Strategic Objectives
As already been mentioned, the company’s long-term mission is to be the top brand and manufacturer of stylish ladies shoes in Abu Dhabi and the entire UAE. However, its strategic objective includes: revenue maximization; establishment of high-status retail presence in Abu Dhabi and its environs; expanding the market of its products through vigorous promotion and multi-channel marketing; and optimization of a company’s operations to reduce costs and satisfy customers.
Revenue maximization will be achieved through business expansion, which requires increased brand awareness, increased retail outlets and hiring qualified sales personnel. High-status retail presence will be achieved by locating retail outlets at prime locations and through market segmentation. The product promotion will entail the use of the mass media, internet marketing, trade fairs, strategic alliances, and contract marketing among others. Optimization of key operations will be achieved by streamlining the cost structure, consumer satisfaction and constant evaluation of the company’s operations.
Ownership and Management
Hamdan Footwear will be owned by partners. The number will be around 5 partners in the beginning. The partners will contribute equally in the day-to-day operations of the company. This is due to the fact that they all have extensive knowledge and experience in the footwear industry, particularly in designing female footwear. The company will also hire production supervisors, foreman, mechanic, helpers, marketing executives, procurer, accountant, office messengers and watchmen. The owners will act as the managers and designers.
Location and facilities
As previously been mentioned, the company’s administrative and operating offices will be based in Hamdan Street, Abu Dhabi, as well as its semi-mechanized footwear production unit. Its retail stores will be spread across the five major cities in the UAE, that is, two in Abu Dhabi, two in Dubai, one in Sharjah, one in Al Ain and one in Ajman.
Products
Product Description
Hamdan Footwear will focus on producing stylish and affordable ladies footwear. The footwear will include sandals, sleepers and rubber shoes. Even though leather shoes account for approximately 48 percent of the UAE market, the demand for rubber and plastic shoes is increasing day by day, hence the company’s product choice (ICCI 1).
Key of products
Hamdan footwear will create trend-setting ladies footwear under its own brand. They will be sold at affordable prices. Their products will include sandals, sleepers, and closed and open rubber shoes. Out of the three products, rubber shoes will be considered to be the main product. However, the production of the three varieties of shoes will depend on seasonal trends. The shoes will range from number 6 to 11.
Future Products
In the future, the company plans to start manufacturing leather shoes. The production of leather shoes requires a considerably high amount of capital. The company is also planning to diversify its products to include men and children’s footwear. In addition, the company will expand its ladies footwear designs to include Stilettos, pumps, court shoes and boots among others.
Company’s competitive edge
The company’s main competitive edge is its unique products, product pricing, and owners’ extensive experience and expertise in footwear design. Other competitive advantages will include: proficiency in production, historical contact with the targeted areas of sales, and promptness within a limited budget. During the first year, the proprietor will carry out all the company’s operation with a limited number of employees. However, additional workers will be hired in the subsequent years. The owners and the employees will work as a team, enabling direct evaluation of all employees and direct participation so as to make sure that clients’ needs and expectation are met.
The competitive edge of unflagging professionalism will be upheld through prompt response to client inquiries, timely delivery of consignments, and reserving breaks for the employees among others. The company’s products will be unique and stylish, and will be sold at reasonable prices. The owners have over a decade experience in shoe design. This will be an added advantage to the company. The owners having worked for local shoe companies as designers also provide a competitive edge since they have interacted with some of the clients on a personal level. In addition, the company will employ highly qualified staff. Last but not least, the company’s highly qualified personnel will ensure that the projects are completed on time and within the budget.
Market and Sales Analysis, and Plan
Competencies
The business idea and plan have been validated through a market research. The footwear market in the UEA is growing rapidly and it is highly valued. Almost every street in major cities in the UAE has retail stores selling footwear products. The location of the company’s retail stores is very strategic. The product pricing is also reasonable and competitive. The basis of the market research is to make us stand out among our competitors. The market research focused on the competitors, whereby we looked at their pricing, products, customer service, and the general business.
Customers
The footwear market in the United Arab Emirates is estimated to be over a billion Dirham. Most of the footwear is imported from China and Europe, particularly Italy and Spain. Over the last decade, the country’s demand for footwear has increased tremendously. The increase in demand is partly attributed to the rising urban population, changes in lifestyle, increased number of tourists who visit the country to shop, and changing retail footwear market. Males provide the largest market for footwear products in the UAE. This attributed to their population dominance. The number of males in the UAE is almost three times that of females (ICCI 2).
In the year 2014, the market for stylish footwear in the UAE was estimated to be over 1.7 million. This market comprises of women between the age of 18 and 35 living in the major cities. The market was worth more than $ 100 million and is anticipated to reach $180 million by 2017. Women between 18 to 35 years represent 12 percent of the total population within the target market. They are expected to spend more than $200 million in the next 3 years (ICCI 3).
Demographics and Geographic
As already been mentioned, the target market is female consumers from five major cities in the UAE, which are Abu Dhabi, Dubai, Sharjah, Al Ain and Ajman. Abu Dhabi and Dubai provide the largest market for the company’s products, with a combined population of over 1.3 million females between the ages of 18 to 35. Sharja, Al Ain and Ajman have a combined population of around 250000 females between the ages of 18 to 35 (Federal Research Division 5).
Market Analysis Pie Chart
Behavioral factors
Female consumers in the UAE not only consider shoes to protect and soothe their foot, but also for image and fashion. Regardless of their small number, women tend to buy more shoes than men. Typically, men always buy around two to four pairs of shoes annually, while women buy up to ten pairs of shoes in a year. Unlike western women who prefer Stilettos, court shoes and boots, women in the UAE prefer sandals, open shoes and sleepers. This largely attributed to the weather pattern in the Gulf region, which is extremely hot. The UAE market is divided into two segments: the lower segment and the upper segment. The lower segment constitutes of relatively cheap plastic and rubber shoes, whereas the upper segment is predominantly leather products. Nevertheless, trend-setting plastic and rubber shoes are also found in the upper segment (ICCI 3). The above factors will help the company to adapt production and marketing strategies to cash in on these influences in a manner that will meet the needs of the consumers and distributors.
Marketing Strategy
Target Market
The company will target female consumers between the ages of 18 to 35. The target market will be the five metropolitan cities in the UAE that have already been mentioned. Since the company will focus on manufacturing stylish and affordable ladies shoes, it will target both lower and upper segment of the market. The market is characterized by large European and Asian brands. Nonetheless, there is no leading distributor of footwear products. This is attributed to a large number of players in the market. As a result, competition is very stiff.
Pricing Strategy
Hamdan Footwear will set prices, which reflect savings when compared to the actual value of the product. The company’s brand products will be priced at the upper edge to match the general positioning of the company as a high quality product and service provider. At the initial stage, the company will set prices, which will be 15% mark-up on the cost of production and later a mark-up of 25% on the cost of production. The setting of prices relative to those of competitors is expected to be effective since the target market for Hamdan Footwear’s brand are mostly middle-class city dwellers. In addition, low prices are associated with poor quality. These middle class city dwellers will be the largest consumers of the Hamdan Footwear in the five major cities in the UAE.
Promotional Strategy
In order to further the growth and development of the company’s brand, the activities of advertising, online marketing, discounting and publicity will be used to entice customers. Promotional strategies will be used in defining and locating the target audience for the product and clearly passing the specific message. The promotional strategies will be employed in creating awareness of the presence of the Hamdan Footwear brand in the UAE market. The promotional strategy to be used will ensure that the target customers get the right information about the Hamdan Footwear products by making use of the right medium and strategy. It will also ensure that the customers easily access the company’s products. By promoting the products, the level of visibility of the products will be maintained, and the volume of the demand for the products will be set to an applied margin.
Direct sales could be made from the production center and through the company’s websites. Sales promotions will be implemented during special occasions, for instance, holidays and festive seasons. Discounts and rewards will be offered during sales promotions to increase sales volume. The company will also make use of the social media, which has become a very significant platform for marketing in this day and age.
Management and Staffing
Organization Structure
This simply describes the division, grouping, and coordination of tasks within the company. The organizational structure is well illustrated in the chart below.
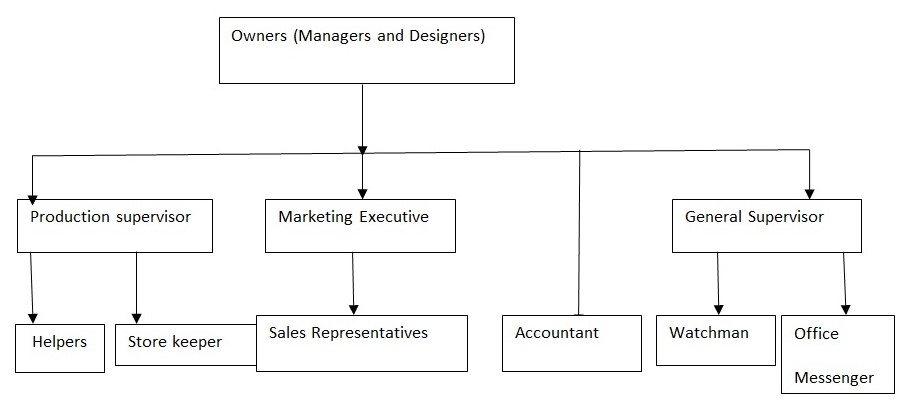
The company will be led by the owners, who will act as the managers, as well as the designers due to their vast experience and expertise in footwear design. They will be assisted by production supervisors, general supervisors and marketing executive. The production supervisor will be in charge of the production unit, whereas the general supervisor will be responsible for the general activities in the company. Last but not least, marketing executive will be in charge of the retail stores and distribution of the company’s products.
Staffing
According to Cunningham, it is easier to hire a squirrel to climb a tree than teach a turkey. He used this phrase to demonstrate competency based recruitment practices. (5). He defines competency as a principal characteristic of a person that fundamentally linked to effective or excellent performance at work. Therefore, competency is any individual characteristic that is assessable and can be used to differentiate a poor performer and greater performer (Cunningham, 6). The company’s recruitment and selection process are not only based on qualification, but also competency. The core competencies recognized by the company are; the capability of an individual to acclimatize promptly to external and internal changes, the ability to successfully influence and work through others, the ability to change mindsets and behaviors, leadership abilities, and the capacity to work with others. Others include objectivity, personality concepts, content knowledge, cognitive skills and behavioral skills. Additional training is also provided.
Financing the project
Description of initial budgets and financial needs
Start-up Capital
This project will be fully funded by the owners. The startup capital will be approximately 2095000 AED. The proceeds will be shared according to individual contribution. The fixed and working capital requirements for the project are shown in appendix 1.
Machinery and Equipments required
Furniture and Fixture Requirements
Office Equipments
Sales Budget
The production capacity will be around 800 pair of shoes per day, of which 60 percent will constitute sandals and sleeper, while the rest will be rubber shoes. Sandals and sleepers will be sold at 100 AED per pair, while the rubber shoes will be sold at 80 AED per pair. During the first year, the company production capacity will be 50 percent (400 pairs per day), while the optimal capacity will be 80 percent (640 pairs per day). The optimal capacity will be achieved in the fourth year. Therefore, there will be a 10 percent increase in production capacity per year. Assume the company will only be in operation for 300 days per year, the production capacity for the first, second and third year will be 7392000 pairs, 1267200 pairs and 15259200 pairs respectively. The sales budget is well illustrated in appendix 2. It is projected that 70 percent of sales will be made in the first year. The rest will be carried forward to the next year. The second and the third year will record 80 and 85 percent sales respectively.
Collection Budget
This is a schedule of anticipated cash collection (Aziz 3). 70 percent of sales are expected to be made in the first year. The second and the third year will record 80 and 85 percent sales respectively. Cash collection budget is shown in appendix 3.
Material Budget
It contains materials bought to meet the requirements of the production budget (Brewer 89). The materials used in the production of ladies shoes include: upper materials (textile and plastic and rubber fall), insole materials (shoe-textile, cellulose board, Bontex and Texon), outsole materials (PVC, thermoplastic rubber and polyurethane), grinderies (shoe laces, threads, tapes, rivets and hooks zip fastener among others), and auxiliary materials (adhesives and finishing chemicals). The material budget is shown in appendix 4.
Manufacturing Overhead Budget
It contains all the manufacturing cost incurred excluding direct material cost and cost of direct labor (Aziz 6). Manufacturing overhead budget is shown in appendix 6.
Cash Budget
It provides all sources and use of cash within a considerable period of time. It well illustrated in appendix 7.
Depreciation of assets
It shows the value of an asset after usage. Depreciation is calculated using a straight-line method, which considers the original cost, salvage value and useful life. Asset depreciation is shown in appendix 8.
Direct labor budget
It indicates the number of hours that will be used to produce a certain unit of output/product. It is well illustrated in appendix 9.
Operating Expenses Budget
It shows costs incurred in the value chain, excluding production cost. It is well illustrated in appendix 10.
Income Statement
It indicates the net income after deducting cost of goods sold and operating expenses. See appendix 11.
Owners equity
This is basically the net income plus the amount invested into the business, See appendix 12.
Budgeted Balance Sheet
It shows all the assets, liability and the owners’ equity. See appendix 13.
Projected Sales Revenue
This shows the amount of revenue to be acquired through sales in the next 3 years. More details are available in appendix 14.
Projected Cash Flow
It highlights the projected cash balance. See appendix 15.
Projected cost of sale
This is the projected aggregate cost of direct material, direct labor and manufacturing overhead. See appendix 16 for more details.
Projected operating expenses
These are projected annual operating expenses. See appendix 17.
Projected manufacturing overhead
These are the projected manufacturing overhead cost for the next three years. See appendix 18.
Projected direct labor cost
See appendix 19 for more detail.
Projected balance sheet
See appendix 20 for more details.
Works Cited
Aziz, Saqib. Preparing the Master Budget, Lille: Pearson Education, 2013. Print.
Brewer, Garrison. Management Accounting, New York: McGraw-Hill, 2012. Print.
Cunningham, Linsey. (2007). “Talent Management: making it real”. Development and Learning in Organisations 21.2 (2007):4-6. Print.
Federal Research Division. Country Profile: United Arab Emirates (UAE), Washington, D.C.: Library of Congress, 2007. Print
ICCI. Footwear Market in UAE. Web. 2015.
Appendices
Appendix 1: Fixed and Working Capital
Appendix 2: Sales Budget
Appendix 3: Collection Budget
Appendix 4: Material Budget
Appendix 5: Material Disbursement budget
Appendix 6: Manufacturing Overhead Budget
Appendix 7: Cash Budget
Appendix 8: Depreciation of Assets
Note: Straight-line method was used.
Appendix 9: Direct Labor Budget
Appendix 10: Operating Expenses Budget
Appendix 11: Income Statement Budget (1st Year)
N/B: Cost of goods sold=Direct Materials + Direct Labor + Manufacturing Overhead