Introduction
Coach Inc. is a major player in the American “accessible luxury” market. The market is of high quality and stylish products similar to luxury goods but priced significantly lower. The company’s mission has remained to provide accessible high quality, luxury items to the American people. The company deals in products such as leather bags, business cases, leather accessories, footwear, jewelry and fragrances.
Coach has used Concentrated Growth by focusing only on the luxury market. The company produces leather accessories of similar design and quality with big luxury brands but offers them at a cheaper price. Employment of the strategy resulted in a 20% growth in annual sales in the years 2000 and 2011. The growth was even bigger in 2012 when the firm registered sales of $ 4.2 billion for the first time in its history. However, in the recent past, this has not been enough to provide the desired growth.
The second strategy Coach Inc employs is Market Development. The company set up stores in Japan, Asia and China, which are international markets. The strategy involved selling the existing Coach merchandise in the different markets, which has proven quite successful as the company now supplies over 200 department stores in 20 countries. Internet marketing also falls under the Market Development strategy.
Reed Krakoff revolutionized Coach Inc’s Product Development strategy in 1996. He developed a new customer-focused method of developing products, which resulted in a strategic advantage for Coach and resulted in 12 collection launches per year up from the previous two. The method involved extensive customer surveys and involvement in the development phase. Further, the products were tested in-store before launch. Going forward, Coach still intends to continue this practice.
Strategic Issues
Coach Inc is currently facing challenges in maintaining its share price and profit margins. Competition in the “accessible luxury” market has also grown quite stiff. European luxury brands such as Gucci and Prada have also started to enter this market with their “Diffusion” brands. These brands carry a similar price point to the “accessible luxury” brands hence eliminating their price advantage.
The Reed Krakoff brand competes with the top-end luxury brands, as was the intention at its creation. However, the brand has not performed as expected. Part of this failure could be attributed to the lack of exclusivity. Coach Inc operates factory stores that sell items at a discounted price. Luxury line customers pay premium prices for owning exclusive products. These factory shops can be blamed for diluting the brand equity for the Reed Krakoff brand.
The company has several strategic options open to management. They can be summarized in a series of questions. Should the company focus more on the new Reed Krakoff line? Is it prudent to increase the men’s’ product lines? Should the company keep both Factory shops and Full Price range shops? Should Coach Inc expand to Europe? Should Coach enter the emerging markets as its competitors are doing? Should the company continue to outsource production to China?
The questions above all culminate in one strategic issue. How can Coach Inc create a sustainable competitive advantage that will result in business growth? This case analysis will look into Coach Inc’s history, status and operating environment with an aim of recommending suitable strategies to improve and maintain company performance.
External Environmental Analysis
Porter’s Five Forces Model
External environmental analysis will be done using Porter’s Five Forces Model shown in the figure below.
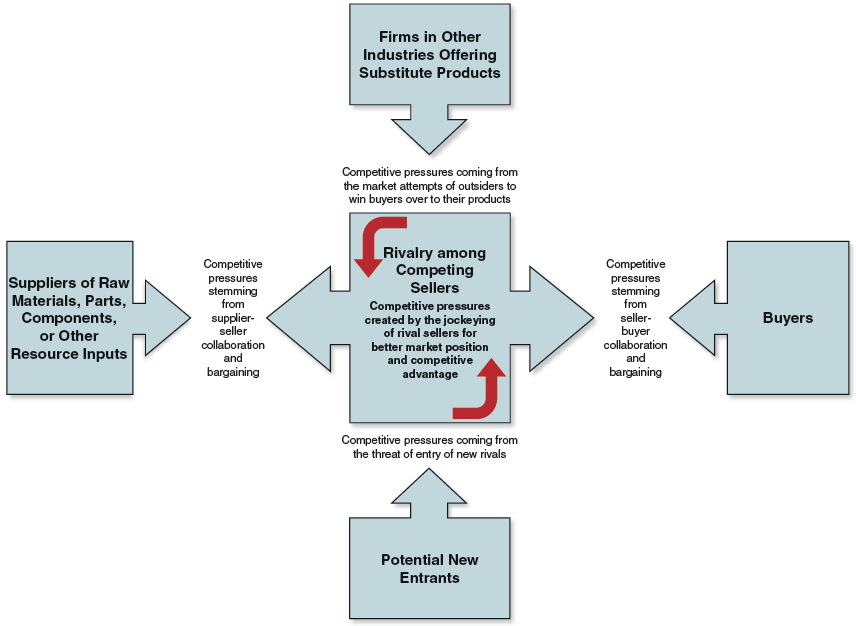
The threat of Market Entry
The threat of market entry indicates how easy it is for a new player to join the luxury industry and de-stabilize Coach Inc’s business. This threat is quite low due to the Key Success Factors in this industry. One major success factor owns a strong brand name. Such names cannot be created overnight. It takes several years to acquire customer trust. Companies have to demonstrate consistent quality and style before customers rate their brand as strong. This is why the majority of the luxury companies are many years old and have been passed from generation to generation. Supposing a new entrant was to attempt to join the business, Coach Inc and other companies would easily come up with strategies to thwart their business before it becomes strong. This is because they have long-term experience in the industry.
Threat of Substitutes
In the case of Coach Inc and its competitors, the biggest threat comes from the counterfeit products. This has been identified as an issue across all manufacturing industries. Such products imitate almost exactly industry products and satisfy customers’ need to be associated with big brands. They also cost much less. This is because they are of much lower quality than the original products. In addition, counterfeiters do not incur the cost of Research and Development of new products as they copy an already existing brand. In order to remain relevant, industry players need to create a unique identifying mark for their products and communicate this clearly to customers. This will enable customers to identify the genuine products and the fake ones. This threat can also be countered by fast innovation such that by the time counterfeiters are copying the design, industry players have already moved on to the next big thing.
Threat of Rivalry
Rivalry threat is quite strong in this industry. There are three major competitors to Coach Inc. These are Dooney & Bourke Inc, Kate Spade Inc., and Michael Kors. All these companies are in stiff competition to capture market share from each other. They engage in competitive advertising among other marketing practises. Each one attempts to gain the attention of the limited number of customers and convert competition’s customers to their own. They are also seen to engage celebrities as their brand ambassadors. Celebrities cannot work for more than one luxury house. The celebrity’s fans will determine the increase in sales obtained from hiring them. Luxury firms also display their products in high-end fashion shows and fairs. They get entertainment media to cover such shows hence further promoting their merchandise. Whenever a luxury firm comes up with a new product, the rest follow suit in record time. Coach has employed the Innovation strategy by launching the Reed Krakoff line. This new line exclusively targets the luxury market. The new strategy has seen the firm produce prestigious products that can match the current luxury players in the market. It is meant to help Coach Inc to penetrate the highly competitive luxury market while remaining dominant in the market for the middle class. They are always monitoring each other. Thus, Coach Inc cannot afford to ignore the threat of rivalry from its competitors.
Bargaining Power of Buyers
This force indicates how capable buyers in the luxury industry are of negotiating better prices or influencing the suppliers. In the case of Coach Inc and its competitors, this force is quite low. Customers in this industry are more of price takers. They rarely influence the prices set by the industry. This is mostly because customers are fragmented. There is no unifying body for luxury customers hence lowering their bargaining power. This is a great advantage for industry players as they are able to charge premium prices on their luxury merchandise. The other unique trait about luxury customers is that they often prefer to pay more for the illusion of quality. They believe expensive is better. The more they pay for merchandise the more they can brag about it. This is another strategic advantage for industry players.
Bargaining power of suppliers
Suppliers’ bargaining power in the industry depends on how critical their product is to the industry player. E.g., suppliers of leather have a very high bargaining power because without leather, there are no luxury bags. Such suppliers can negotiate lower prices thus eroding the industry’s profitability. They can also threaten to sell their leather to competition if the customer refuses to give them their desired price. Manufacturers in China also have high bargaining power. A company such as Coach has outsourced all its production to China. Thus, because the Chinese know they are invincible, they are able to negotiate higher rates hence further eroding the industry margins. Coach Inc. and its competitors need to watch their suppliers carefully to ensure their interests are also intact.
Industry Profile Attractiveness
It is necessary to analyse the attractiveness of the industry where Coach operates in order to determine how it can take maximum advantage of it. The rich are always very sensitive when making their purchases. A little mistake may result into a major shift, and this may affect the sustainability of the firm. The incumbents in this industry such as Dooney & Bourke, Kate Spade, and Michael Kors have gained market trust, and it will require effective marketing and production strategies to compete with them favourably in the global market.
Key Success Factors
Brand Equity
Success in the luxury industry demands companies to have very strong brand names Customers like to purchase well-known brand names such as Louis Vuitton, Gucci, Calvin Klein, Prada, and Ferragamo. Such customers take pride in using exclusive merchandise. They are also willing to spend extra money to acquire exclusive merchandise. Coach Inc has worked over the years to establish its brand name. Brands are associated with quality and style. It is therefore imperative that luxury firms maintain high product quality in order to maintain their brand equity. Coach should also continue to invest in strategic advertising to enhance its brand image. Currently, the company’s customers rate the adverts as attractive and bold.
Continuous Innovation
Luxury companies need to keep innovating in order to succeed in the industry. Each season, new collections are launched. The products in this industry have a perception of high obsolescence hence the need to replace them often. Luxury customers cannot afford to be seen wearing the summer collection in spring. Thus, companies need to be well ahead of customer expectations in terms of innovation. Coach Inc has developed a successful innovation culture driven by Research and Development. This culture has enabled the company to launch new collections each month. Strategically, this means that companies in the luxury industry have to dedicate a sizeable amount of their budgets to Research& Development of new products.
Exclusivity
The luxury industry thrives on the perception of exclusivity. Customers want to feel special after purchasing luxury products. This is why people will spend big bucks to purchase an Apple phone, or wait in line for days for the newest Apple phone to be released. Luxury companies are well aware of this and invest in creating a great customer experience that will make their customers feel special. Coach Inc has tried to create the perception of exclusivity by introducing the Reed Krakoff line. This brand targets high-end luxury customers. However, much more needs to be done on this front. Coach Inc needs to consider the cost-benefit of having the Factory Shops. These shops sell merchandise at a lower price hence making it “accessible”. However, in the luxury world, expensive is better.
Company Situation
Coach Inc was founded at a time when the United States was recovering from Great Depression. The country experienced economic growth during the Second World War and Coach was able to maximise on the increasing purchasing power in the American market. At this time, market competition was very low, and the main area of focus was the production. The firm was assured of a ready market as long as it produced the unique leather handbags. However, things have dramatically changed in this twenty first century. Competition has become stiff as many firms enter this lucrative industry. Currently, Coach is ranked one of the best brands in the luxury apparel industry. However, there are more than nine other companies competing with it in this top position. This clearly indicates that the market competition is very high. In order to conduct a situation analysis of this firm, a SWOT analysis will be necessary at this stage.
SWOT Analysis
Strengths
Coach Inc as a brand has high equity among consumers. This is evident in the fact that the company was able to secure 25% of the American market and 8% of the Japanese market. It indicates that consumers hold the brand in high regard. In Japan, the consumers are also willing to pay significantly higher than their American counterparts are to acquire Coach Merchandise. The major contributor to this is the company’s commitment to provide high quality and stylish products.
The company also has an extensive distribution network. Products are available in over 900 department stores in America, 200 full price stores and 86 factory shops. This network enables Coach Inc to be accessible to its consumers. It is also an advantage over other luxury companies, which are only available in selected locations. Coach Inc has also increased its distribution network by utilizing its website and emailing consumers catalogs frequently. This is particularly important in this digital age.
Coach Inc has a diverse product line. These include women’s handbags, key fobs, belts, electronics accessories, cosmetic cases, gloves, hats, scarves, watches, shoes, and sunglasses. The products present different options to consumers. It also allows consumers to obtain different merchandise branded by one company. Loyal customers may want to collect the different fashion items too. The diverse product line also offers Coach Inc. diversity in income. The company does not rely on the sales of one exclusive item. Coach continues to improve this strength through its innovation efforts and launching a new collection each month.
Since the change in leadership in 1996, Coach Inc has posted strong financial results over the years. The company has managed to maintain an upward trend in revenue growing at a rate of 20% every year since 2000. Average companies can barely maintain single digit revenue growth. Coach has managed to exceed shareholders expectations for over 10 years. The net income also increased to $880 million from a meager $16.7 million in the year 2000.
Coach Inc provides its customers with excellent customer service. The company is known to repair spoilt merchandise, offer different color suggestions that were previously not available and allow customization of merchandise by customers. This ensures that customers feel valued at Coach Inc stores. Happy customers are known to make repeat purchases and carry out word-of-mouth promotion for the brand.
Weaknesses
Coach Inc is an American company hence relies heavily on sales from America. Approximately 76% of the company’s sales are out of its home country. This makes Coach highly susceptible to any changes in the American economy. Supposing the American economy is hit by a recession, Coach Inc will be terribly affected and lose majority of its sales. The best way to counter this is increase global presence to reduce reliance on America. Coach is now able to service clients online from different locations. This was previously not possible. In 2012, Coach Inc has chosen specific international markets to drive its Market Development strategy. These are Japan, Hong Kong and China.
Some consumers as lacking in exclusivity may also see the company. This is because of its mode of distribution which ensures products are available everywhere. The factory stores, which price products lower, are the biggest culprit in creating the illusion of lack of exclusivity. Luxury items consumers are usually willing and able to sacrifice and pay more money to obtain what other normal citizens with lower purchasing power cannot afford. By having these factory stores, Coach eliminates the inability of everybody who wishes to buy its merchandise.
Coach Inc maintains a high level of inventory. In 2014, the inventory days went up by 6% from 37 days to 40 days. This is a major weakness as inventory ties up a company’s working capital. The company needs to look into Just in Time systems.
Opportunities
The major opportunity Coach Inc has is expansion into developing markets. The company has already tried and tested the Japanese market with positive results. This market received the products quite well and consumers are even willing to pay premium prices for Coach Merchandise. Coach needs to invest in growing its brand in Japan. This can be done through advertising and other forms of marketing. Coach has the potential to double its current market share in Japan. The second major developing market is China. Industry projections place the Chinese market potential at 24% of the world’s revenue by 2014. Coach Inc cannot afford to ignore such statistics. Management needs to make a conscious effort to explore the Chinese market and harness it.
Coach Inc has an opportunity to exploit further e-commerce. The company is already using its website but can do much more. They could develop an app, which customers install on their phones. The app would notify customers of any new items in Coach Stores that suit their preferences. Coach could also use this app to collect data as a tool of market research. The company also needs to ensure that its products are carried on major e-commerce sites such as Amazon and E-bay.
Threats
Coach Inc is likely to face stiff competition from other famous luxury brands while entering global markets. Industry players are not going to watch quietly as Coach encroaches on their market share. The company needs to invest in market research in order to anticipate the competition’s reaction and have a counter strategy in place. This is important especially for the European market, which is home to several well-known luxury brands.
The second major threat for Coach Inc is the rapid increase in counterfeit goods. This problem affects all manufacturing industries currently. Statistics indicate that as of 2006, counterfeit products worth more than $500 Billion were sold. This means that genuine companies lost an equivalent amount of revenue. Coach Inc faces the threat of its customers purchasing counterfeit products mistakenly. Once this happens and the quality is not satisfactory, Coach could lose these customers. The brand equity is also at risk of erosion.
Luxury products have high-income elasticity of demand. This means that if income rises, customers will buy more of Coach Inc’s products. Similarly, if income decreases, they will slash more luxury products off their budgets leading to lost sales. However, this threat runs across the industry.
Financial Analysis
Financial Statements Overview
The Balance Sheet and Income Statement at a glance clearly indicate the trouble Coach Inc is facing. The appendix contains financial statements from 2010 to 2014. There has been steady growth in all metrics from 2010 to 2013. However, there is a noticeable decline in company performance in 2014. Sales revenue dropped by 5% from 5,075,400 to 4,806,200 while cost of goods rose by a significant 9.5% from 1,377,200 to 1,509,300. This resulted in a 10% drop in Operating Profit from 1,524,500 to 1,120,100. This indicates that Coach Inc is struggling to maintain its market share in the luxury industry.
Trade receivables increased by 13% from 175,500 in 2013 to 198,600 in 2014 indicating that Coach may be trying to obtain more sales by offering longer credit periods. The current assets declined by 10% from 2,070,900 to 1,855,200 while current liabilities increased by 12% from 722,500 to 813,100. This indicates that Coach Inc could be offering its customers longer credit periods while taking longer to pay its own suppliers. This could lead to accumulated interest on short-term debt, which is quite expensive in the long term. The Gross, Net and Operational profit margins all declined by an average of 5%. Management needs to take drastic action to remedy the situation lest the decline continues. Such performance negatively influences the stock price. This is because analysts have access to the financial statements of all publicly traded companies.
Free Cash Flow
Free Cash flow declined in 2014 over 2013 by about $400 million. This means that Coach had less cash available for investment at hand. Free cash flow is because of several factors including receivables and debtor management, inventory management and investment activities. Companies always aim to have more free cash than the previous year. This drop for Coach Inc indicates an urgent need to improve working capital management.
Liquidity Ratios
Current Ratio
These ratios indicate how easily a business can settle its current liabilities out of its current assets. It is an indicator of the short-term well-being of the company. Coach Inc had a current ratio of 2.45 in 2011. This rose to 2.51 in 2012 and further to 2.87 in 2013. However, in 2014, there was a drastic drop by 20% to 2.28. This indicates that the ability of Coach to settle its short-term liabilities using its current assets has reduced. This can be attributed to offering longer credit periods in order to attract sales.
Working Capital
The company’s working capital has also been increasing over the years from 859,371 in 2011 to 1,086,300 in 2012 and a high of 1,348,400 in 2013. This means that Coach Inc had more funds available to run its short-term business. In 2014, Working Capital dropped by 22% to 1,042,100. This is a cause of great alarm since every business needs working capital to finance the daily operations. The reduction in working capital can be attributed to the increase in the inventory levels held by the company in 2014.
Profitability Ratios
Return on Assets
Profitability of a firm is measured by the return on assets and return on equity ratios. Coach has consistently posted an increase in ROA since 2010. In 2014, there was a sudden drop of 8% Return on Assets from 29.4% to 21.3%. This means that management is making use of the company’s assets 8% less effectively in profit generation than the previous year.
Return on Equity
Return on Equity has been increasing from 48% in 2012 to 52% in 2011 and to a high of 54% in 2012. However, there is a drop in 2013 to 42.9 and further to 32% in 2014. This indicates that management is making use of shareholders capital 10% less effectively in generating returns. These ratios are both a function of Net Income. The drop in income seen in the Income Statement affects these ratios too. Coach Inc urgently needs to improve the revenue in order to improve its profitability. Return on Equity could also be improved by buying back some of the company’s outstanding shares.
Activity Ratios
Inventory Turnover
These ratios measure the effectiveness of the company’s day-to-day business from a non-financial point of view. They are extremely important as they give an indication of working capital management. Inventory turnover indicates how many times in a year Coach Inc sells the amount of inventory carried in the Balance Sheet. This figure has been declining since 2010 from 10.2 to 9.9 to 9.4. In 2014, it declined further by 5% from 9.7 to 9.1. This means that Coach is moving its inventory at a slower rate each year.
Inventory Days
Days inventory on the other hand indicate how many days the company can take on average to dispose of its current stock holding. Coach has managed to maintain an average of 37 days in the previous years. Unfortunately, in 2014 this figure increased by 6% to 40 days. These two metrics combined indicate that Coach is actually selling less stock than in the previous year.
Receivables Turnover
Receivables turnover ratio indicates how efficient Coach Inc’s management is at managing its debtors. This has been declining over the years. The receivables turnover ratio dropped from 33.08 in 2010 to 29.10 in 2011. The ratio dropped further to 24.20 in 2014. This shows that the level of efficiency in issuing credit and recollecting deteriorated. In 2014, it has declined further by 16%.
Days Receivable
Receivables Days represent the number of days Coach would take to collect the receivables carried on the Balance Sheet. This increased by 19% indicating a possibility of increased credit days to customers. This is a poor move for coach given that they already operate on lower margins than mainstream luxury firms do. Management should aim to collect debts faster as Time Value of Money will further erode their margins if debts remain outstanding for long. Customers who take long to pay should obtain the goods at a higher price to counter the Time Value of Money effect.
Leverage Ratios
Debt to Assets Ratio & Debt to Equity Ratio
Leverage ratios indicate the level of borrowing Coach Inc has accumulated on its Balance Sheet. The two ratios computed compare the level of Debt to Equity and Company assets. They indicate what percentage of each of the two would be consumed if Coach was to settle all its debt today. These ratios have increased slightly over the past year by an average of 3%. However, this is no cause for alarm as it still falls below the average done in the previous years. It is possible that the 3% is not an actual increase in debt but rather a change in the conditions for the current debt.
Competitive Strength Matrix
As stated previously, Coach Inc is operating in a highly competitive industry with many players who have higher financial capacities. In order to protect its market share, it will be necessary to review the competitive strength in order to identify the areas of weakness that may require review. This may require the firm to conduct a self re-evaluation in all its strategies and systems. The competitive strength wholly depends on the internal systems and strategies of the firm. That explains why at the base of the pyramid are internal capabilities. These value requirements are needed to make the firm operate within the expectations. The second level of the pyramid is the products’ and service features. They define the values that this firm delivers to the market. The third level is the customers’ benefits, which are values that a firm promises to, offer its customers. It is important to avoid promising what a firm cannot deliver because this may lead to the customer dissatisfaction. It is in the fourth level that the competitive positioning of the firm is defined based on the three pillars defined above. At the top of the pyramid is the essence that defines the firm and what it stands for in the market.
Objectives
Coach Inc has maintained impressive performance over the past decade, and this is evident in the financial statements shown at the appendix. However, the last two years have witnessed a small negative deviation that should be addressed. One of the main objectives that this firm should be working on now is as stated below.
To increase total sales of Coach Inc’s product by 20% within the next year.The objective should be specific and measurable. The objective set above is very clear in what should be achieved. The measure of the increase in sales has been set at 20%. The period within which, this should be achieved has also been defined as one year. This objective seeks to address a specific problem of low sales that is reducing the firm’s revenues. It is evident that the approach to be used has not been defined.
Coach Inc’s management should monitor four key KPIs. These are Sales Revenue, Cost of Production, Receivables turnover and Return on Investment. The target for sales revenue should be a 15% increase. This is quite important after the decline of 5% in 2014. The Cost of Production target should be set at a decline of 12%. This is a key objective because it highly affects profit margins. Receivables turnover target should be set at 35%. This ratio has been declining over the years and urgent corrective action should be taken immediately. Management should aim to raise the Return on Equity to 45%. The current decline to 32% is quite discouraging to shareholders and they may opt to move their money out of Coach Inc. Coach Inc should simultaneously work on its production efficiency. This non-financial measure should be improved at a rate of 10% annually.
Recommendations
Coach Inc is at crossroads again in 2012. The company performance has started declining and competition is becoming stiffer. This was the situation back in 1995. Management needs to take drastic decisions that will improve the current situation and create competitive advantage. There are several issues to be addressed in this decision. These include the decision on whether to focus on men’s lines or keep women fashion as the core business, whether to keep or divest the Reed Krakoff brand, whether to enter the emerging markets and Europe and whether to continue producing out of China. The recommendations will be presented under the five grand strategies Coach could use to recover its business.
Concentrated Growth
This strategy involves focusing on one particular market and selling more in this niche. Coach Inc has already established itself in the “affordable luxury” market. It is one of the most risk-averse options. It requires Coach Inc to keep doing what it has been doing and hope to attain more sales. The company could target competitors’ customers by enhancing its branding. This will make its products seem more superior hence command greater brand equity. Branding can be improved in-store and on adverts.
Luxury companies have been known to engage high profile celebrities as their Brand Ambassadors. Coach Inc could consider hiring a celebrity to wear their brand hence promoting it, especially to the youth. This strategy can be complemented by holding fashion shows and events where Coach Products are showcased.
Coach could attempt to attract non-users of luxury brands. These are ideally people who can afford but are currently not interested in the products. This can be done by producing mini-versions for sampling or increasing advertising in places where such potential consumers are likely to be found. This includes salons, spas, beauty parlours and shopping malls. The company could hire some sales people to initiate interest in their products in these locations.
Concentrated Growth also has its disadvantages. This strategy may fail if the competitive landscape is changing fast. Coach needs to monitor competitor activity in order to be ready with a reactive strategy. Alternatively, the company could combine this strategy with the others suggested in this recommendation below.
Product Development
This grand strategy involves the creation of new products for Coach Inc’s current market. This is possible through adaptation, modification, magnification, substitution, re-arrangement, reversal, or combination. Coach can also develop quality variations of its current products. However, quality variations may not be the best strategy for a luxury goods company. This is because it makes the brand susceptible to equity erosion. Customers may start to associate the brand with lower quality.
This strategy can aid in extending the lifecycle of a product. Customers may view an item that has undergone product development as a new product. Thus, the company can continue selling it for a longer period.
Market Development
This strategy involves Coach Inc selling its current lines into new but related markets. The products can be modified slightly to suit the new market. Coach Inc is already considering this strategy. The company has already identified Japan, Hong Kong and China as its potential new markets for development. Japan has already been tested and consumers have received Coach Inc’s products extremely well.
The company cannot avoid using this strategy because competition is already planning to enter developing markets. Coach Inc should move fast to gain customer loyalty before competition sets up in the emerging markets. The advantage of this strategy is that Coach Inc will be cushioned from the adverse effects on business of changes in the American economy. This is because the company will be obtaining income from several different countries. However, Coach also needs to be cautious of exchange rate differences, which could cause losses during reporting.
Concentric Diversification
This grand strategy involves acquisition or starting a new business that benefits from the core competencies of an already existing business. Coach Inc has developed technology and skills in the fashion business. Thus, an ideal diversification would make use of these competencies and bring positive returns to both businesses.
The development of the Reed Krakoff line can be classified as Concentric Diversification. This is a luxury line, which will benefit from Coach Inc’s competencies in the “affordable luxury” business. However, the major risk involved is that customers that buy luxury products may fail to differentiate the two brands hence reject the diversified brand as poor quality. Reed Krakoff will only be a success if Coach Inc is able to create a sense of exclusivity around this brand.
Innovation
Innovation is a grand strategy, which involves spending extensively on Research and Development to come up with new products. Apple Inc has reaped massive benefits from innovation. Coach needs to come up with new items that will command premium pricing. This will allow it to enjoy first-mover advantage before other players copy the products.
Innovation is a costly and risky strategy to adopt. A company may spend millions developing a product, which fails in the market on launch. However, Coach Inc has already started developing an innovation culture. The involvement of consumers in this process ensures the chance of favourable results is increased. Coach has been launching new collections every month as opposed to two annually. It is recommended that the company maintain this momentum.
Vertical Integration
This grand strategy involves Coach Inc acquiring its suppliers or direct customers in order to foster synergies in the business. Currently, Coach Inc carries out its manufacturing work in China. It also sources leather from the best tanners in the world. This strategy has worked well so far. It is recommended that the company maintain its supply chain as is.
The disadvantage of engaging in Vertical Integration is that it adds complexity to the business. In addition, the acquiring company may lack the core competencies required to run the acquired companies. Coach Inc has always outsourced its manufacturing successfully. This strength needs to be maintained.
Cost Leadership Strategy
This generic strategy is suitable for Coach Inc as the company has already been in operation for many years. Cost Leadership requires Coach Inc to leverage on its manufacturing expertise to lower its cost of production and as a result raise its product margins. This can be done through employing Total Quality Management practises, which will result in savings. Cost Leadership Strategy works best in a scenario where the company also adopts the Vertical Integration Strategy discussed above. E.g., Coach can acquire its largest leather suppliers thus influencing the Transfer Price of this major raw material. Thereafter, Coach employs effective manufacturing practises thus greatly lowering cost of production.