Introduction
Suleiman A.G is a German-based firm that specializes in manufacturing and distributing machine tools and robots. This paper aims at analyzing the financial performance of the business establishment from 2001 to 2004. The period was important for the firm because it was the duration in which significant financial performance outcomes were realized. The analysis could be utilized by the stakeholders of the company and it would help them know the direction that the firm was taking in terms of growth and investments. In addition, it would help investors to make important decisions about future investments based on economic projections.
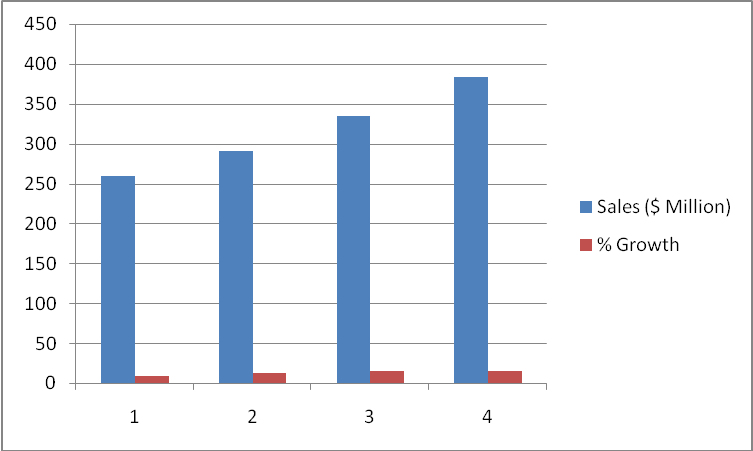
The sales growth
The management and stakeholders of a firm learn about important sales trends using sales growth figures. Analysis of sales growth helps in the determination of product lines that are characterized by the best sales and those that need some improvements in order to register better sales. Sales growth analysis of Suleiman A. G indicates that the firm made significant growth trends from 2001 to 2003. In 2001, the firm achieved sales of $240 million. The following year saw an increase in sales from $240 million to $ 259.9 million. In terms of sales growth percentages, the increase in sales was equivalent to 8.3%. The significant sales increase was a good start in a new century because the following two years also recorded very impressive growth sales for the firm. Specifically, Suleiman A. G recorded sales growth of 12.1% and 14.9% in 2002 and 2003 in that order. Conversely, sales did not grow in 2004, which could be attributed to several factors within the firm. In fact, sales of products sold by the multinational company in 2004 reduced by 0.2%. Although the percentage drop in sales could appear insignificant, it could have important implications for the business establishment. The stagnation of sales could imply that the existing markets were not growing; a fact that could be used by the management to look for better markets both locally and internationally. The following figure represents the graphical information with regard to sales growth of Suleiman A. G.
Operational leverage
Percentage cost of goods sold
Operational leverage is an important aspect in business establishments because its analysis helps stakeholders to know how a firm manages costs in the process of doing business. Business costs could be caused by variable or fixed factors. Analysis of the cost of goods sold in the four years does not indicate significant changes. In fact, the cost of goods sold remained at 67.75% in 2002, 2003 and 2004. However, the firm recorded 67.9% cost of goods sold in 2001, which is also quite comparable to the constant figure (67.75%) that was recorded for the other three years. The insignificant changes with regard to the cost of goods sold could be utilized to learn about important aspects of Suleiman A.G. The business establishment realized very impressive profit margins on the premises that its sales were growing rapidly, but its costs of goods sold generally remained constant. This could have been brought about various factors in the firm and the surrounding business environment. For example, the management could have adopted better approaches to preventing significant changes in the costs of producing and distributing products. It is important to conclude that the multinational firm was fairly leveraged.
Percentage administrative and selling
Generally, the company recorded slight changes from 2001 to 2004 with regard to the percentage administrative and selling expenses. There was a drop of 0.2% in 2002 from 16% that was noted in 2001. However, the expenses reduced insignificantly from the 15.6 % that was recorded in 2003 to 15.5% in 2004. The slight changes in the administrative and selling costs could imply that the firm adopted best strategies of controlling expenses and maximizing profits.
RoIC and value creation levers
Before investors could make important decisions about investing in firms, they consider the extent to which management teams create value of investments. Thus, value creation and addition are essential aspects of strategic management. RoIC (return on capital invested) in the context of Suleiman could give important hints on whether the company used investments from shareholders to make significant financial gains. The following equation was utilized to calculate return on capital invested:
RoIC = (Net income – dividends)/ Total capital invested in a business
Calculations based on the given equation yielded the following results.
Figure 2. A table showing a summary of the calculations of the return on capital invested in Suleiman in 2001, 2002, 2003 and 2004.
Notably, there were slight increases in the value of returns on invested capital. The RoIC results imply that the firm created value of the investments of its investors. Thus, it could be easy for potential investors to consider the firm as an attractive avenue of investment because it rewarded its investors with good returns on their money. In fact, the RoIC results could also be used by lending institutions to decide whether to offer the firm some loan facilities.
Sales to capital employed
A sales to capital invested ratio offers a correlation between sales realized from a certain amount of capital in a particular financial period. In fact, the ratio is used to determine the extent to which a company utilizes its resources in generating income. Thus, it would be expected that companies that have relatively high sales to capital employed ratios are characterized by high chances of using their resources in making financial gains. It is worth noting that, in the 2001 to 2004 period, Suleiman A.G did not record any change in the sales to capital employed ratio because it remained at 1.4 in all the financial years in the period. Although the ratio was constant, it gives important indications with regard to how the firm used its resources. First, it could be concluded that the business establishment prudently used its assets in realizing financial gains. Second, the constant ratio could imply that the management was not keen on growing sales by increasing the capital invested by shareholders. Thus, the firm used the amount of capital it could manage effectively to make profits and good return on equity.
Working capital turnover ratio
The ratio is used in firms to assess the extent to which companies can use their working capital to impact revenues. Positive and/or constant changes of the ratio could be an indication of prudent use of working capital of a firm. On the other hand, a negative working capital turnover ratio could imply that a company does not invest its capital wisely to achieve an excellent turnover within a given period. In the context of Suleiman A.G, the working capital turnover ratio improved from 4.8% to 5.4% in 2001 to 2004 respectively. Thus, the firm effectively used its working capital to make positive financial impacts.
Fixed assets to sales
The ratio is utilized to determine the degree to which a firm uses its assets in generating sales. Fixed assets are not affected by short-term financial implications that could impact a business. It is worth noting that Suleiman A. G recorded slight improvements of its fixed assets sales ratios from 5.9% to 6.7% in 2001 to 2004 respectively. This could imply that the organization invested its assets prudently to realize good sales.
WACC and the economic profit (EVA)
WACC and the economic profit ratio values are used to determine expenses with regard to capital by incorporating various factors that could affect the costs of doing business. In fact, sources of capital are mainly considered in this context. Suleiman A. G could obtain capital from sales of its shares, bonds, short-term loans and long-term loans, among other sources. WACC was calculated using the following equation:
WACC= (E/V) Re + (D/V) Rd * (1-t)
WACC = Cost of Debt x weight of Debt (D/(E+D)) + Cost of Equity x Weight of Equity (E/(E+D))
Where Cost of Debt = 4.9, Cost of Equity= 9.265, E = 974,000, D= 2,883,100
WACC = 4.9*2,883,100(2,883,100/(974,000+2,883,100) + 9.265*974,000(974,000(974,000+2,883,100)
WACC = 16.5%
Thus, in the given period, the firm was in a position to improve its capital that could be used to generate income.
From the annexes, it could be deduced that economic profit (EVA) of Suleiman A. G increased throughout the 2001 to 2004 period. This implies that its net profit and net income values were not adversely affected by factors such as long-term debts. In addition, it could be due to stable markets in which the firm distributed its high quality products.