Introduction
Apple Inc. is an American-based company that designs and manufactures consumer electronic products and software (Linzmayer 1991). It has a strong market presence in the personal computer, Smartphone, digital music, and tablet markets. Macintosh is its best selling personal computer product, while the iPhone and the iPad are the company’s flagship products in the Smartphone and tablet markets (Heracleous & Papachroni 2013). Apple’s software products include the Mac OX S operating system and iTunes. The Apple app-store and iCloud products are some of the latest entrants in this category.
Apple’s market presence stretches beyond American borders. It operates in more than 15 countries globally (Kane & Rohwedder 2010). These markets accommodate more than 437 stores (Kane & Rohwedder 2010). In the same markets, Apple has created a strong global brand that resonates throughout the global corporate scene. In this regard, the company’s success is only second to Samsung electronics, which has a greater revenue stream (Ramstad 2009; Shaughnessy 2013). Besides being the second-largest technology company, Apple is the third largest mobile phone company in the world (Shaughnessy 2013). Its strong market capitalisation (valued at more than $500 billion) also sets it at the top of the list of the largest publicly traded corporations in America (Shaughnessy 2013). Certainly, recent statistics show that Apple is among the most valued companies, globally (Valdez 2012). These facts only highlight the company’s success in the global corporate scene.
Recently, there have been concerns regarding the change in leadership after the death of the company’s founder, Steve Jobs (Gustin 2013; Heracleous & Papachroni 2013). Such concerns have led some pundits to question the company’s ability to sustain its success in future decades (Gustin 2013). Mostly, these questions aim to probe the company’s future in the hands of the new company Chief Executive Officer (CEO), Tim Cook. This paper delves into the details of these concerns by conducting a critical analysis of how the company’s finances, competition, product innovation, and strategic decision-making processes affect the company’s future. This analysis is a case study of two reports by Ireland & Hoskissen (2009) and Ashcroft (2010). Their reports show how market changes have affected Apple’s competitive landscape.
How Changes in the Market have provided Apple with a Competitive Battleground
Many market analysts agree that much of Apple’s success stems from its market leadership in the technology industry (Apple Insider 2007; Kane & Rohwedder 2010). Particularly, Apple has had an edge over its competitors through the launch of the iPhone and iPad products (Trembath 2011; Apple Insider 2007). These flagship products account for the company’s competitiveness in the mobile phone and tablet markets (Carton & Woods 2008). However, within the past few years, other technology companies have eroded Apple’s competitive edge (Reuters 2007). Particularly, the market activities of Samsung have greatly threatened the company’s market dominance in the mobile phone market (Shaughnessy 2013). For example, recent reports show that the Korean-based company is the largest mobile handset maker in the world (Shaughnessy 2013). Similarly, Xiaomi of China could easily substitute the iPhone, as a relatively cheaper premium Smartphone, thereby threatening Apple’s market dominance in this segment. In line with the same concerns, the Android operating system has gained global popularity and overtaken other mobile software products to become the most commonly used mobile phone software in the world (Shaughnessy 2013). Regardless of these developments, Apple retains its dominance in the technology market by being the most profitable company in the industry. For example, Gustin (2013) says the company takes more than 69% of the Smartphone industry profits. Most of these profits come from the mobile phone market because the company gets about $1billion (monthly) from its iPhone sales (Golijan 2010). Smartphone sales alone account for more than 50% of the company’s revenue (Gustin 2013).
Although Apple enjoys market dominance in the mobile telephone market, its other successful flagship brand, iPad also suffers from intense competition, from other products in the market (Kim 2012). For example, new Google, Samsung, and Microsoft have launched competitive substitute products that have eroded iPad’s market share (Shaughnessy 2013). Relative to this fact, 2013 statistics show that Apple’s iPad shipments declined from 19.5 million to 14.6 million (Shaughnessy 2013). Comparatively, Samsung increased its volume of global shipments by more than 277% (Shaughnessy 2013). The popularity of the Android operating systems in the tablet market has also contributed to Apple’s misfortunes in this segment because global manufacturers use Apple’s operating system in only 32.5% of the tablets, worldwide, while the same producers use the Android operating system in about 62.6% of the tablets, globally (Shaughnessy 2013).
The competitive pressure on Apple has largely contributed to the company’s decline in market capitalisation (Bajarin 2011). Greenlight Capital (2013) and Cacciatori and Jacobides (2005) say this development has worried Wall Street analysts and shareholders who believe the company is losing its market dominance. However, the company’s CEO (Cook) believes this development should not worry stakeholders (Shields 2013). Although Apple has strived to manage its stock price through a stock buyback program, it has been unable to change the company’s poor performance, relative to the competition. In the same regard, the company’s stock price declined by 10% in 2013 (Shields 2013). Comparatively, at the same time, Nasdaq’s price had increased by 20%, while Google’s stock price increased by similar margins (Shields 2013).
Strategic Decision-Making (Post-Steve Jobs)
Many people doubt that Apple’s success will continue in a post-Steve Jobs era (Gustin 2013). In fact, in 2012, the company’s stock share price significantly declined after the death of Steve Jobs (Shields 2013). Within this period, the company’s share price declined by more than one quarter of its value (Shields 2013). This event led many experts to question whether the company’s best days were past it (Shields 2013). These concerns have found a strong impetus among critics who say, under Cook’s management, Apple has not shown the same leadership prowess in the technology market as it did during Steve Job’s time (Snell 2009; Lazonick 2009a). Critics also say this is Cook’s greatest undoing because technological leadership was responsible for most of the company’s success. People who hold similar views have used the recent security breach in Apple’s iCloud to support their views about the failures of the new management to continue with the success that Apple enjoyed. The security breach involved an incident where hackers leaked confidential pictures of naked Hollywood celebrities to the public. Although the company quickly took steps to seal the security loopholes, critics say the incident affirms the lack of ideas and initiative by the company to expect problems in a post-Steve jobs era (Gustin 2013; Rushe 2014). People who hold opposing views differ with the above analogy because they say Apple has launched some new products under Cook’s leadership (Gustin 2013). For example, the company launched the new iPhone6 under his leadership. Similarly, the company launched the new Apple watch under the new management. Although these products did not receive the same level of success that Apple’s flagship products did, their relative successes show that the company continues to pursue its innovative strategy (Ireland & Hoskissen 2009). Comparatively, supporters of Cook, such as Gustin (2013) and Rushe (2014), argue that the launch of the iPhone6 has been successful. In fact, similar to Job’s era, Apple’s customers lined up in long queues to buy the new product. Within the first week of the product launch, Apple said that it sold more than 9,000,000 units of the phone (Rushe 2014). This success shows that the company has the potential to design, market, and sell new products, successfully, in a post-Steve Jobs era. Besides steering the company’s success in this regard, Wall Street respects Apple’s new management. Similarly, Silicon Valley respects Cook (Rushe 2014).
Three-Dimensional Strategic Analysis
Financial Strength
Back in 1997, Apple’s success was unpredictable. Few people would have thought that a “garage project” started by Apple’s founders, Steve Jobs and Steve Wozniak, would grow and become a multi-billion dollar business. Apple’s statistical growth depicts this fact because the company rose from having assets worth $2 billion in 1997 to $417 billion in 2011 (Heracleous & Papachroni 2013). This growth led the company to become the world’s biggest company, in terms of market capitalisation. Compared to other technology-based companies, such as Microsoft, Apple remains an industry leader because it has a market capitalisation of $573 billion, while its closest competitor, Microsoft, has a market capitalisation of $273 billion (Heracleous & Papachroni 2013). In contrast, Apple’s market capitalisation amounts to 4.5% of the S&P 500 (Heracleous & Papachroni 2013). Similarly, Heracleous & Papachroni (2013) add that Apple’s market capitalisation accounts for 1.1% of the global equity market.
Based on an elaborate business model, characterised by innovation and synergy, the California-based company has built huge capital reserves (Lazonick 2010). More than $108 billion annual revenues have contributed to developing these huge reserves (Valdez 2012). In this regard, Lipton (2013) says that Apple has more than $82 billion in net cash reserves. To support its sound financial position, appendix one (Income statement) shows that Apple’s has reported increased sales numbers since 2011 (after Steve Job’s death) (Daily Finance 2014). These numbers also show that the company continues to make profits, regardless of the intensity of competition, or uncertainties in the global economy. Apple’s positive financial position also manifests in the company’s balance sheet (see appendix two) (Daily Finance 2014). Based on 2011 – 2014 statistics, the company’s asset portfolio increased from $116 billion to $231 billion within this period (Daily Finance 2014). Although the company’s liabilities have increased in the same regard, evidences of its increased market capitalisation show that Apple enjoys a good financial position (Yahoo 2012). The pie chart below explains the main products that account for the company’s sound finances.
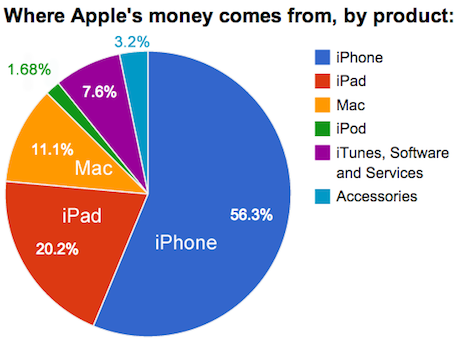
As depicted from the diagram above, most of Apple’s revenues come from the sale of the iPhone and the iPad. In fact, Lazonick (2013a) says both products account for more than 70% of the company’s sales volumes. Therefore, the company’s success may depend on the success of these products.
Relative Market Share
Apple’s market share in the technology sector varies with the type of product created. The iPad has the largest market share of 75% (Parker 2011). The iPhone also has a huge market share. The launch of the iPhone6 has improved the company’s performance in this regard because observers say the product launch improved the company’s performance (Gustin 2013). Before the launch of this product, the company had lost a significant proportion of its market share. Hormby (2014) attributes the lost market share to the company’s failure to innovate and produce new products. While understanding this fact, it is also important to mention that before Apple suffered immense competitive pressures from other market entrants, the company often commanded a huge market share in most of its product categories. For example, the company commanded a huge market share when it launched the iPod (Gustin 2013). Conservative estimates show that the company commanded more than 90% of the mp3 player market (Gustin 2013). The company also reported significantly higher market shares when it launched the iPhone and the iPad (Gustin 2013). Much of the company’s success, in this regard, stems from its ability to build a strong ecosystem of product dependability. Aggressive marketing, sleek product designs, and product supply are also other factors that contributed to the company’s success in this regard.
Apple’s products often follow the traditional market structure, where the products grow, mature and decline (Cohan 2014). However, the company’s innovative marketing strategy was able to counter product decline (Gershon 2009). Stated differently, before the products reached the decline stage, the company launched a new product that would continue its success. However, in Cook’s time, this has not been the case. Instead, Apple has reported significant market declines in most of its key products segments (notably, the iPhone and the iPad). However, the industry’s market segments are not declining. For example, although the iPhone market has matured, the Smartphone market is growing. Indeed, Cohan (2014) says that the global Smartphone market recorded sales of more than 295 million units in the first quarter of 2014. This figure was a 27% increase in global sales for the same period in 2013 (Cohan 2014).
Part of Apple’s declining market share stems from the increasing popularity of Android-enabled smartphones. For example, in 2014, Android-enabled smartphones captured a new market share of 85% (Cohan 2014). This market share growth has happened at the expense of Blackberry and Apple. Doubtless, Apple remains the leader in the premium Smartphone market. However, its sales volumes are significantly lower than its rivals (notably, Samsung and LG) are (Shaughnessy 2013; Graziano 2012). Apple also trails its leaders in the mass-market segment because Android-enabled smartphones lead in this regard (Yoo-chul 2010). Overall, although Apple trails other companies in mass-market dominance and sales volumes, it is unlikely that other companies would challenge its dominance in the premium market segment (soon). Therefore, the company’s market share is bound to be strong in this segment (Slivka 2010).
Relative Market Strength
Apple’s market strength is likely to show the same pattern outlined in the market share section. Here, it is important to pay a close attention to the mobile phone market because most of the company’s market strength comes from this market segment. However, as shown in this paper, the California-based company continues to report significant market failures that have supported increases in Android sales in the past decade. Apple has lost its market strength in this regard. The following diagram shows this trend.
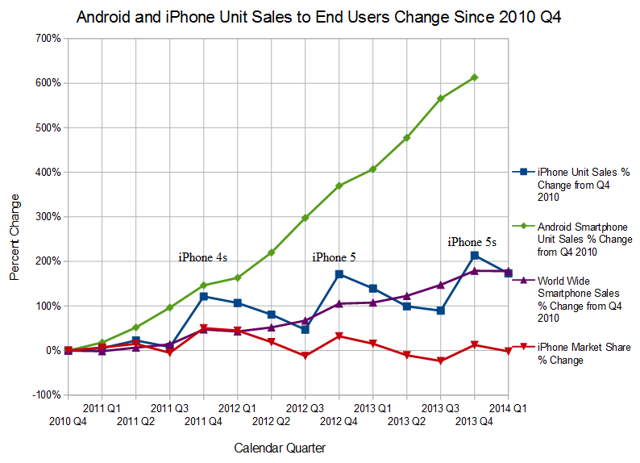
Although the iPhone6 launch helped to arrest Apple’s declining market share, it cannot prevent the company’s declining market strength. The iPad market also suffers from extreme competition from Apple’s rivals. The company is also losing its market strength in this regard. The same is true for the personal computers and online music markets.
How Well Does Apple Understand the Industry’s Critical Success Factors (CSF)
Understanding an industry’s CSF is a prerequisite for the success of any business (Freiberger & Swaine 2000; Lazonick & O’Sullivan 2000). Particularly, it is important that telecommunication firms understand the industry’s key success factors because this sector is volatile and susceptible to changing consumer preferences and competitive market behaviours (Junglas & Harris 2013). Research conducted by Matsudaira (2013) shows that research and development, innovation, advertising, branding, distribution, and breadth of product lines are critical success factors in the telecommunication industry. Apple has strategically positioned its organisational processes to reflect the industry demands of these key success factors. The following table shows how the company has positioned itself in this regard.
First Mover and First Mover Advantage
Lazonick and Tulum (2011) and Grant (2003) describe first mover advantages as those that a company enjoys if it is the first to enter a market. Apple has always enjoyed this advantage because, in the past, it has enjoyed technological leadership through new product launches. Observers believe first mover advantages have mainly contributed to Apple’s success. This advantage aligns with the company’s innovation strategy.
Product/Process Innovation
At the centre of the debate about Apple’s innovation strategy is an argument regarding the benefits of pursuing an innovation vs. incremental strategy (Lazonick 2013b). During Steve Job’s time, innovation was characteristic of the company’s success. However, during Cook’s time, an incremental strategy has taken centre stage (“incrementalism” refers to an initiative by a company to improve the functionality of existing products, as opposed to developing new products). McCray (2009) said, since the launch of the iPad, the company has not launched any new products. The recent launch of the Apple smart-watch still has an uncertain future because the market has been unreceptive, compared to the launch of the iPad, iPod, and iPhone (Wolverton 2010). In response to concerns that the company is losing its innovation edge, a recent publication quoted Cooks saying, “Some people see innovation as change, but we have never really seen it like that” (Lazonick 2013b, p. 1).
Summary: Sustaining Competitive Advantage
The financial assessment of Apple Inc. shows that the company still enjoys a good financial position. This assessment also means that Apple’s products are critical to the financial stability of the company (Mazzucato 2013). However, some products will be more critical to the company’s financial growth in the coming decade. Notably, the iPhone will be more critical to the company’s financial growth because of its importance to modern society. VAM (2014) shares this view when it says modern society greatly relies on the mobile phone (Smartphone) to undertake daily tasks. Particularly, it draws our attention to the ability of the iPhone to carry out most functions that other Apple products do (VAM 2014). For example, it says the iPhone could act as a personal computer and a music player (substituting the functions of the iPod and iPad) (VAM 2014). Therefore, the iPhone will be essential for the company’s future growth. Stated differently, Apple’s sustained competitive advantage will depend on the success of the iPhone. Management will also play a crucial role in defining the company’s future success. However, based on the minimal success that Apple’s new products have had in the past few years, it is incorrect to assume that the company’s success will be unsustainable because of a change in management. Although the new leadership team has not surpassed the same level of success that Apple had (under Steve Job’s management), it is too early to dismiss the company’s slow growth as a complete failure of Cook’s leadership (Lazonick 2009b). Therefore, one could say that Apple is experiencing a transition period, which makes it hard to predict if the company may fail to reach the same levels of success that it did under Steve Jobs, or not.
References
Apple Insider 2007, Apple’s iPhone the No. 4 U.S. handset during third quarter, Web.
Ashcroft, J 2010, iPod To iPad: Innovation And Entrepreneurship At Apple, Web.
Bajarin, B 2011, Why Competing with Apple Is So Difficult, Web.
Cacciatori, E & Jacobides, M 2005, ‘The Dynamic Limits of Specialization: Vertical Integration Reconsidered’, Organization Studies, vol. 26, no. 12, pp. 1851–1883.
Carton, P & Woods, J 2008, ChangeWave survey shows consumers abandoning basic models for advanced RIM and Apple phones, Web.
Cohan, P 2014, Can Apple Halt Its Eroding Market Share, Web.
Daily Finance 2014, Apple: Financials, Web.
Freiberger, P & Swaine, M 2000, Fire in the Valley: The Making of the Personal Computer, McGraw-Hill, London.
Gershon, R 2009, Telecommunications and Business Strategy, Routledge, New York.
Golijan, R 2010, The Tale of Apple’s Next iPhone, Web.
Grant, R 2003, Cases in Contemporary strategy analysis, Blackwell publishing, New York.
Graziano, D 2012, IDC: Samsung passes Apple to become No.1 in smartphones, Web.
Greenlight Capital 2013, Greenlight Capital urges Apple shareholders to oppose company’s proposal that would impede Apple’s ability to unlock shareholder value, Web.
Gustin, S 2013, Two Years After Steve Jobs’ Death, Is Apple a Different Company, Web.
Heisler, Y 2014, Why the Mac vs PC marketshare debate is outdated, Web.
Heracleous, L & Papachroni, A 2013, Practicing Strategy: Text and Cases, SAGE, London.
Hibben, M 2014, Why iPhone 6 Won’t Reverse Apple’s Market Share Decline, Web.
Hormby, T 2014, The Story behind Apple’s Newton, Web.
Ireland, R & Hoskissen, R 2009, Understanding Business Strategy, Cengage Learning, Mason.
Junglas, I & Harris, J 2013, ‘The Promise of Consumer Technologies in Emerging Markets’, Communication of ACM, vol. 56, no. 5, pp. 84-90.
Kane, Y & Rohwedder, C 2010, Apple Strives for Global Markets, Web.
Kim, H 2012, Huawei Aims for Higher Profile in Smartphone, Web.
Lazonick, W 2009a, Sustainable Prosperity in the New Economy? Business Organization and High-Tech Employment in the United States, Upjohn Institute for Employment Research, New York.
Lazonick, W 2009b, ‘The Explosion of Executive Pay and the Erosion of American Prosperity’, Entreprises et Histoire, vol. 57, no. 1, pp. 141-164.
Lazonick, W 2010, ‘Innovative Business Models and Varieties of Capitalism: Financialization of the US Corporation’, Business History Review, vol. 84, no. 4, pp. 675-702.
Lazonick, W 2011, Apple’s jobs: A rebirth of innovation in the U.S. economy, Web.
Lazonick, W 2013a, ‘The Financialization of the U.S. Corporation: What Has Been Lost, and How It Can Be Regained’, Seattle University Law Review, vol. 36, no. 1, pp. 857-909.
Lazonick, W 2013b, The Theory of Innovative Enterprise: A Foundation of Economic Analysis, Web.
Lazonick, W & O’Sullivan, M 2000, ‘Maximizing Shareholder Value: A New Ideology for Corporate Governance’, Economy and Society, vol. 29, no. 1, pp. 13-35.
Lazonick, W & Tulum, O 2011, ‘US Biopharmaceutical Finance and the Sustainability of the Biotech Business Model’, Research Policy, vol. 40, no. 9, pp. 1170-1187.
Linzmayer, O 1991, Apple Confidential: The Real Story of Apple Computer, Inc., No Starch Press, San Francisco.
Lipton, M 2013, Bite the Apple; Poison the Apple; Paralyze the Company; Wreck the Economy, Web.
Matsudaira, K 2013, ‘Making the Mobile Web Faster’, Communication of ACM, vol. 56, no. 3, pp. 56-61.
Mazzucato, M 2013, The Entrepreneurial State: Debunking Private vs. Public Sector Myths, Anthem Press, New York.
McCray, W 2009, ‘From Lab to iPod: A Story of Discovery and Commercialization in the Post-Cold War Era’, Technology and Culture, vol. 50, no. 1, pp. 58-81.
Moritz, M 2010, Return to the Little Kingdom: How Apple and Steve Jobs Changed the World, The Overlook Press, New York.
Parker, P 2011, The 2011-2016 World Outlook for Mobile Phone Handsets, ICON Group International, New York.
Polsson, K 2013, Chronology of Apple Computer Personal Computers, Web.
Ramstad, E 2009, Samsung’s Swelling Size Brings New Challenges, Web.
Reuters 2007, O2 UK digs deep for iPhone, Web.
Rushe, D 2014, Apple doesn’t need another charismatic leader. It needs Tim Cook, Web.
Shaughnessy, H 2013, Eight Leadership Lessons from Apple and Samsung, Web.
Shields, T 2013, Apple CEO Cook rebuts $9 billion tax avoidance claim, Web.
Slivka, E 2010, Coverage of Apple’s iPhone 4 Press Conference, Web.
Snell, J 2009, ‘Steve Jobs Holds Court’, Macworld , vol. 26, no. 1, pp. 24-25.
Trembath, A 2011, The iPhone and the Invisible Hand of Government, Web.
Valdez, E 2012, Apple, Samsung Top Profit and Sales, Web.
VAM 2014, Apple Inc. Case Analysis, Web.
Wolverton, T 2010, Another Next-generation IPhone Surfaces, This One in Vietnam, Web.
Yahoo 2012, Apple Inc. financial performance, Web.
Yoo-chul, K 2010, Sony, Apple, Dell are Samsungs big buyers, Web.
Zakas, N 2013, ‘The Evolution of Web Development for Mobile Devices’, Communication of ACM, vol. 56, no. 4, pp. 42-48.
Appendix
Appendix One: Income Statement
*All numbers are in millions, except per share items and the number of employees
Appendix Two: Apple Inc. Balance Sheet
*All numbers are in millions, except per share items