Introduction
Brambles Limited is a leading logistics company whose headquarters is in Sydney, Australia. Brambles grew from a small company established by Walter Bramble in 1890 to a multinational operating in six different continents. Brambles Ltd is currently listed on the Australian stock exchange. It provides logistics solutions to businesses. This includes pallets, crates, and containers for transporting goods. Additionally, Brambles provides optimization services for Supply chains. The Company has two major business divisions IFCO and CHEP. Last year, Brambles divested one of its major business divisions, Recall.
Today, Recall is traded as a different company on the ASX. Brambles Ltd has no stake in the new company. However, each of the shareholders owns shares in Recall in proportion to what they own in Brambles. The aim of this divesture was to allow Brambles to focus on its core business of logistics.
Recall’s core function is business support through information management. Recall specializes in data storage services and retrieval solutions, among other data handling services. These services are essential for businesses in the information age. Recall’s customers are companies operating in environments with high information traffic. They include banks and hospitals.
IFCO is the newest division. The company formed IFCO to respond to the increasing environmental concerns. IFCO serves “green” businesses by providing transport and logistics solutions. These solutions are based on reusable plastics, which reduce negative environmental impact. IFCO is very popular in America. IFCO division is a market leader in its segment. Given the continuing adoption of green business practices, IFCO also has great potential for growth. However, IFCO has not reached the levels of operational prowess of competitors.
CHEP is the oldest division at Brambles. It forms the foundation for the other divisions. CHEP is engaged in the provision of logistics solutions. The division provides pallets for manufacturers, retailers, and distributors interested in moving goods with minimum destruction. CHEP also provides containers and transport solutions. Globalization fuelled CHEP’s growth. Companies that outsource their production or export their final products are CHEP’s major customers. Tom Gorman is the CEO of Brambles Limited. He has led the company since 2008.
Systematic Risk
An investor faces this risk because of investing in a particular market. It affects all the stock in the market regardless of company or industry. Systematic risk is also referred to as “un-diversifiable” risk, which means that an investor cannot escape the risk by investing in a different stock in the same market. Systematic risk is also the opportunity cost of risking money. Systematic risk is caused by macroeconomic factors. These issues affect the entire economy. This paper explores the systematic risk associated with the Australian Stock Exchange where Brambles is listed (Lussier & Achua 2012).
Examples
Companies listed on the Australian Stock Exchange operate in different currencies, which give rise to foreign exchange risk – the risk that a company can lose revenue because it operates in a different currency rather than its reporting currency. Losing money occurs especially if companies operate in different countries and report in another country.
Liquidity risk affects all investors in the ASX. Sometimes there is a lack of liquidity among investors, which makes it difficult to execute buy-sell transactions. Inability to buy or sell on-demand increases the probability that an investor will incur losses. The major liquidity risk that increased the ASX systematic risk was the 2008 financial crisis. The graph below shows how lack of liquidity diminished market returns in 2009. Companies and individuals suffered in the financial crisis. Unfortunately, Brambles responded more severely than the market to the new systematic risk level. The company’s returns reached the lowest point during this financial crisis (Invest Smart 2014).
The ASX also reserves the right to dispute resolution in case of emergencies or market disruptions. The ASX Corporation has established rules, procedures, and practices of this dispute resolution. The rules are non-negotiable. Thus, ASX Corporation’s decision is final and investors do not have to be consulted before it is made which puts the investor at risk of loss if an unfavorable decision is taken against them. In extreme cases, such decisions could result in the halting or suspension of securities. Additionally, such decisions have a direct negative impact on the value of the security (Brambles Limited 2012).
Unsystematic Risk
This is the risk inherent to security because of its unique nature. It can also be described as a “diversifiable” risk. Diversification means that an investor can avoid systematic risk by avoiding the particular stock altogether. Adding the Systematic and Unsystematic risks will give in the total risk associated with a security.
Examples
Brambles Limited has two major unsystematic risk factors in its financial statements. This paper focuses on two major risks: liquidity and leverage.
Liquidity indicates a company’s ability to meet all its financial obligations on time. In order to measure Brambles’ liquidity, three ratios are computed in the table below. The combination of these ratios gives an indication of the company’s liquidity position.
The liquidity ratios show Brambles’ ability to meet its immediate liabilities. Unfortunately, it seems Brambles operates on a lot of short-term credit. The payables constitute a large amount in the current liabilities. The current ratio has been worsening since 2011. It has decreased from 0.85 to 0.76 and finally 0.69. This trend is alarming. It raises the question of whether Brambles is overtrading.
The Quick ratio removes the distortion effect of inventory on the current ratio. Brambles posted an even poorer trend in the quick ratio than the current ratio, which is another cause for alarm. Finally, the inventory turnover period indicates how long items stay in inventory before the company manages to sell them. Companies consider shorter inventory turnover days better than longer turnover days. In this case, Brambles Inventory days increased to an all-time high of 5.1 days in 2013. This could indicate difficulty in moving inventory. Investors should however not put too much emphasis on the inventory ratio since Brambles is not primarily a trading company. Most clients rent pallets and containers instead of buying those (Brambles 2014).
Leverage indicates the financial risk a company is exposing itself to by using debt financing.
All the computed leverage ratios indicate that Brambles is a highly geared company. It depends on debt to finance most of its operations. The company decreased its leverage in 2012, probably by paying off a long-term loan, which is evident in the Debt-Equity ratio. The ratio decreased from 257% to 201%. However, leverage by all the measures increased slightly in 2011. An investor who is averse to financial risk should not invest in Brambles.
Leverage benefits equity holders. They get increased returns from the use of debt. However, it also puts them at a high risk of loss if the company defaults on its loans. Lastly, Brambles also faces competition risk. Iron Mountain Incorporated and Greystone Logistics Ltd are the major competitors. They offer similar services to Bramble, thus competing for similar clients.
The company returns
Major events of BXB
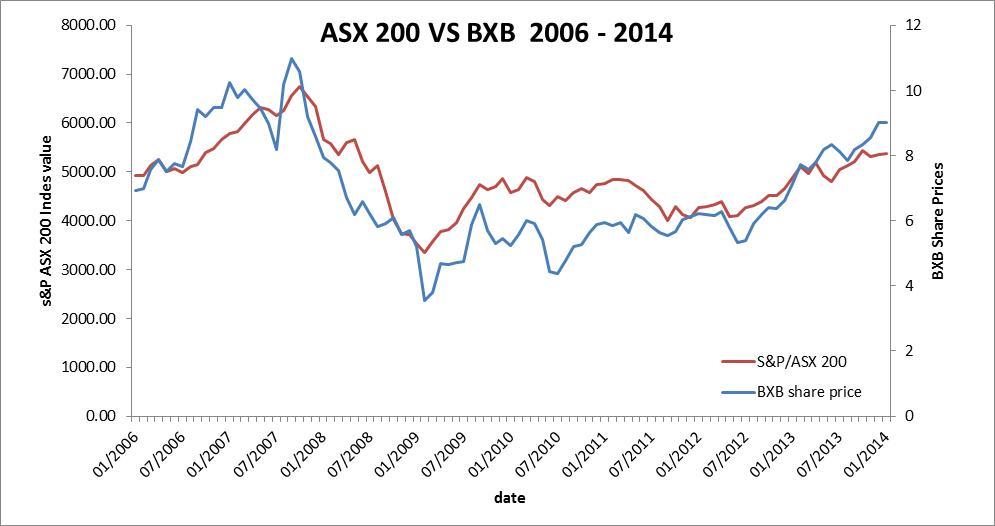
Comments
This graph describes the major events of BXB Company during the period of 2006-2014. As it shows in the graph, the share prices have fluctuated much since the year 2006. It also shows that BXB Ltd has been more sensitive to the changes. It reeled on the effect more than ASX, which is the Australian financial marketing exchange. BXB reached a peak in September 2007 due to the increase in sales and the excellent performance before it suddenly started decreasing sharply to an all-time low in February 2009. The slump was occasioned by the global financial crises that started in 2008. In April 2009, BXB Ltd’s share price value started improving slowly. The share price value would subsequently fluctuate around a value of 5.63 until 2012. Then, the share price slightly started to increase and it has been increasing since then. In addition, it is expected to get even better in the future (Business week 2014).
BXB Profitability Ratios
Profitability ratios aid investors in determining how well the potential investment will pay returns. Three ratios are computed: Return on Capital Employed (ROCE), Profit Margin, and Asset Turnover.
The Return on Capital Employed is obtained by dividing the Sales revenue by the Equity and Long Term Liabilities. Equity and Long-term Liabilities are used as the proxy for capital employed. ROCE ratio indicates how well the company managed the resources at its disposal during the year. Brambles posted the best returns in 2012 of 19%. This was an improvement from 17% in 2013. However, there was a drop to 14% in 2013. This shows that the company increased its assets disproportionately to its profit.
Brambles Ltd seems to maintain an almost constant net profit margin between 17% and 18%, which is a good indicator that the company manages its operating expenses properly and consistently (Invest Smart 2012). The asset turnover ratio indicates how much the company makes using its capital employed. Capital employed is used since it gives a true picture of the resources available to the company during the year. Brambles’ asset turnover improved from 0.97 to 1.09 in 2012. However, like the ROCE, asset turnover decreased to 0.79 in 2013. The reason for this is still the disproportionate increase in company assets compared to profit. The decrease of 0.3 is not too large as to be alarming. However, investors should watch this trend to see that it does not continue (Barrow, 2011).
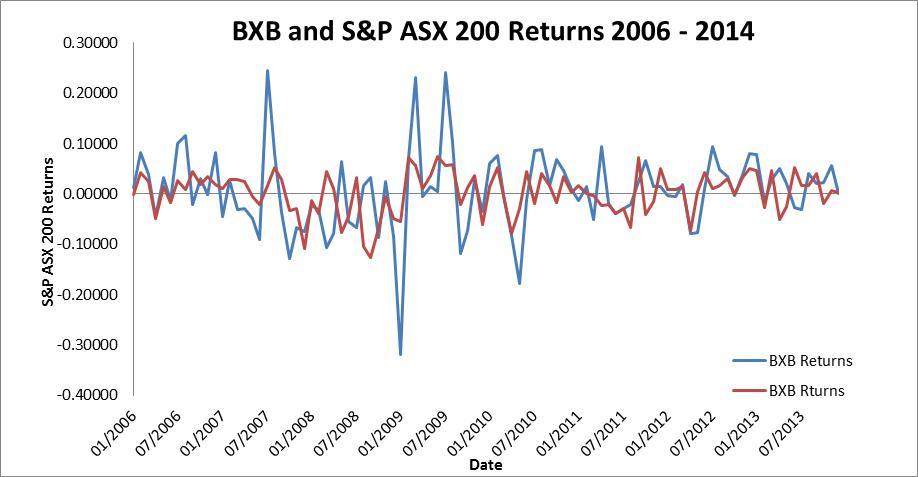
BXB Returns

Figure 2 describes the returns of BXB Ltd compared to the ASX during the period of 2006-2014. Returns rates have been fluctuating. As it shows in the graph BXB LTD and ASX returns are almost moving together, however, BXB Ltd has a stronger response than ASX to the changes. It is usually higher when it is increasing and lowers when it is decreasing. BXB reached a peak in July 2007 with a Returns Value of 0.24480. In January 2009, returns dramatically deteriorated, reaching the lowest level ever, because of the global financial crisis. In March 2008, returns improved and increased sharply with returns of 0.23158. From May 2009 to July 2012 the returns rate kept fluctuating substantially because of the beginning of the European debt crisis. However, it started to even out and it has been normal until the end of 2013. Analysts expect it to remain stable (Bloomberg 2014).
Conclusion
This report assessed Brambles Limited in terms of its major ratios. The profitability ratios paint a positive picture of the company. The company is definitely profitable. The current divisions also show promising growth potential. Therefore, investors can safely assume that this trend of profitability will continue. Liquidity ratios on the other hand are slightly low. On average, Brambles can meet only 60% of its current liabilities on demand. The explanation for this is the high trade payables and lag between delivery and payment. Leverage ratios are a cause for alarm. They are exceptionally high which indicates that Brambles is a high-risk company.
The systematic and unsystematic risk analysis shows that Brambles is quite a risky investment. Investors in the company can invest in Brambles and expect good returns in the future. However, due to the high leverage, risk-averse investors should avoid investing in Brambles.
References
Barrow, C. (2011). Practical Financial Management: Key Financial Statements Tools of Financial Analysis Business Planning and Budgeting. New York: Kogan Page.
Bloomberg. (2014). Brambles stock. Web.
Brambles Limited. (2012). Investors. Web.
Brambles. (2014). Brambles. Web.
Business week. (2014). Stocks snapshot. Web.
Invest Smart. (2014). Brambles. Web.
Lussier, R. & Achua, C. (2012). Leadership: theory, application, skill development. Mason, Ohio: Thomson/South-Western.