Abstract
The aim of this paper is to explicitly review the authenticity of Deere & Company in terms of financial performance to guide the client as a finance manager on the best investment decision. Deere & Company is a public company based in America and trades on the New York Stock Exchange. The selection of the company is based on a number of factors such as a strong brand name, significant presence across the globe, heavy investment on research and development, and high financial performance. The results of the research show that the overall financial position of the company improved over the period. Also, the stock prices are steady. The ratios analysis shows that the company has a favorable liquidity position and high leverage level. The earnings per share ratio is high while the price earnings ratio is low. There are a number of risk factors that are likely to affect the future performance of the company. These factors make Deere & Company the most suitable to invest in.
Background of the company
Deere & Company was formed in 1837. The founder John Deere was a discoverer and a blacksmith. The company has experienced significant growth, development, and expansion since its formation in the 1800’s. Deere & Company is a public company that is based in America. It trades on the New York Stock Exchange with a sticker symbol DE. Further, it operates in the heavy equipment industry. The company offers a wide range equipment and machinery that are used in construction, forestry, and agriculture industry. Some of the other equipments manufactured by the company are lawn mowers, UTV, and diesel engines. It also offers financial services to its clients. For reporting purposes, the operations within the Deere & Company are segmented in three divisions which are “financial services, agriculture and turf, and construction and forestry” (Magee, 2005, p. 23). Deere & Company faces stiff competition in each category of products it sells. Some of the competitors for the agriculture and turf segment are AGCO Corporation, Toro Company, and CNH Global N.V among others. Under, Construction and forestry segment, the competitors are Caterpillar Inc., Volvo Construction Equipment, Posse PLC., and Komatsu Limited among others. This paper seeks to carry out an analytic review of the performance of Deere & Company for the past three years (Magee, 2005).
The rationale for selecting the company
The choice of Deere & Company is based on a number of factors. First, the company has a strong brand name. The company has been in operation since 1837. This implies that it has been in function for more than 170 years. Thus, it has survived all economic situations during the more than a century of operations. Further, the company has been listed as among top 50 most prized companies by the Fortune Magazine. The second reason is that the company has a significant presence across the globe. The revenues generated by the company are divided into the US and Canada besides outside the US and Canada. The financial data shows that about forty percent of revenue is generated from regions that are outside the US and Canada. Currently, the company is expanding its coverage in the international market.
The third reason for the choice of Deere & Company is that it spends a significant amount on research and development. For instance, research and development expenses rose from $1,433.6 million in 2012 to $1,452.0 million in 2014. This shows that the company is dedicated to develop and manufacture high quality products. The final reason for the selection of the company is that it has a strong financial performance. As will be discussed in the subsequent section, the performance of the company has improved greatly since its formation. Revenue, net income, assets, and the shareholders’ value have improved significantly since the company was formed. Another reason is that the developing economies are changing from manual to automated agriculture. This gives the company a rich market that can guarantee future improvement of performance. Besides, expansion into the emerging markets such as Brazil, China, and India is likely to improve the fortunes of the company in the future. These reasons make the company most suitable for investment (Magee, 2005).
Financial data
A summary of the data for the company is presented in the table below.
Income statement
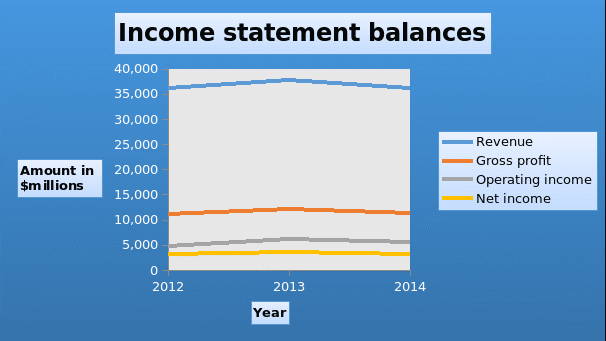
The company reported a significant improvement in the amount of revenue generated during the period. There was an increase in revenue between 2010 and 2013. In 2014, the company reported a 9% dropped in revenue. The revenue is expected to drop further by 20% in 2015. The gross profit and the operating income also followed a similar trend. There are a number of factors that contributed to the decline and future drop in sales. Some of these factors are trade agreements, the negative effect of the state debt, disruptions of capital markets, fiscal and monetary policies, significant volatility in prices of farm commodities, and severe emissions regulations (Deere & Company, 2015). The other factors were negative influence of foreign currency exchange, increased production cost and lower volumes of shipment than in the previous years. These factors also resulted in a higher ratio of cost of sales to net sales. Even though the income generated from net sales dropped, finance and interest income rose in 2014. This can be attributed to the large credit portfolio (Deere & Company, 2015). The component of other income also rose as a result of increased insurance premiums and revenue generated from other services.
In terms of expenses, the company reported a decline in the amount of selling, administrative, and general operating costs. This can be attributed to the sales of the water operations and separation of landscapes. Further, there was a decline in the value of research and development because some projects were completed. The interest expense dropped over the period due to declining borrowing rates. Other operating expenses rose over the period. The increase was caused by increasing depreciation expense, write-offs, and increasing insurance claims. Thus, it can be observed that a number of factors contributed to the trend of balances that were reported in the income statement. The graph presented below shows the trend of the income statement values for a period of three years. The graph will give a clear depiction of the values.
Balance sheet
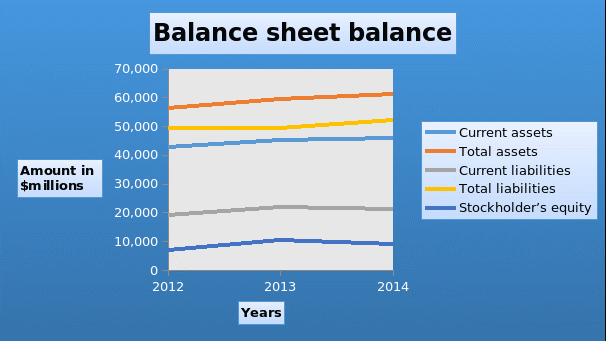
The company has reported a continuous growth in the financial position since 2010. The current assets rose from $33,367 million in 2010 to $46,044 million in 2014. The finance receivables make up a significant proportion of the current assets (Deere & Company, 2015). The total assets also rose from $43,267 million in 2010 to $61,336 million in 2014. A closer review of the assets shows that a significant proportion of the total assets is made up of the current assets. A further analysis of property, plant and equipment show that the company made a number of acquisitions during the year. The additions amounted to $1,376 million in 2012, $1,158 million in 2013, and $1,016 million in 2014 (Deere & Company, 2015). Therefore, they have been declining over the period. However, depreciation expense rose from $555million in 2012 to $696 million in 2014. The company uses LIFO to value inventories that are based in the United States. Inventories in other regions are valued using FIFO. The inventory balance declined over the period. The current liabilities rose from $14,364 million in 2010 to 21,233 million in 2014 (Deere & Company, 2015). Short-term borrowing, and accounts payables and accrued expenses take a significant proportion of the current liabilities. The long term borrowing accounted for about half of the total liabilities. Since the business is capital intensive, the company heavily relies on borrowing as a way of raising funds for investments. The amount of borrowing has grown to about four times the amount of equity. The long term liability rose from $21,577.7 million in 2013 to $24,380.7 million in 2014. The shareholder’s equity rose from $6,290 million in 2010 to $9,063 million in 2014 (Deere & Company, 2015). The graph presented below shows the trend of the income statement values for a period of three years (Magee, 2005).
Cash flow statement
There is no clear trend that can be observed in the cash flow statement. However, it can be observed that the company was in a position to generate positive cash flow from operating activities during the period. Further, investments were made during the period. The highest amount of investment was made in 2013. This can be attributed to short and long term borrowings and issuance of shares. The net change in cash was low during the years. Despite the massive investments made during the period, the company had a significant amount of free cash flow throughout the period except in 2012. This allows the company to invest in available opportunities (Magee, 2005).
Stock price analysis
The table presented below shows the monthly stock prices for the company for the past three years, that is, between, 1st January, 2012 and 31st December 2014.
In the table, it can be observed that the share prices of the company have not changed significantly during the period. The graph presented below shows the trend of the monthly share prices for a period of three years. In the graph, it can be observed that there is no clear trend in the share prices. However, there are months when the stock prices are high. For instance, in the month of November, it can be observed that the share prices are high. The share prices can be considered to be stable (Steven, 2007). This can be an indication that the share prices and the performance of the company is stable and that the changes are caused by seasonal variations.
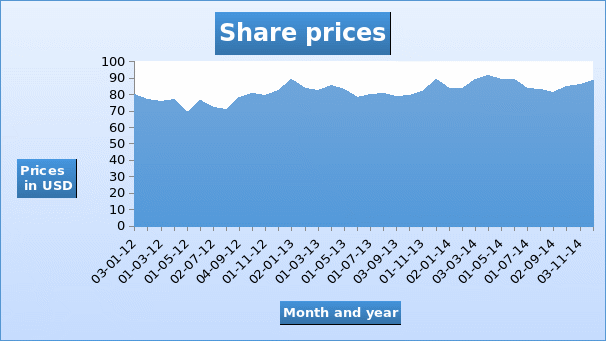
The graph presented below shows the trend of daily share prices for the past three years. The data for the daily stock prices is presented in the appendix.
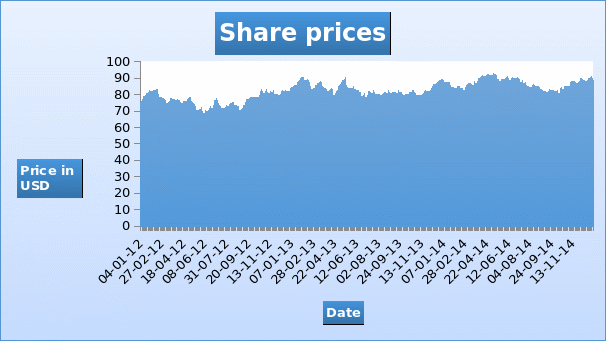
In the two graphs, it can be observed that the trend of monthly and daily share prices are similar.
Dividends
The table presented below shows a summary of the dividend paid by the company during the period.
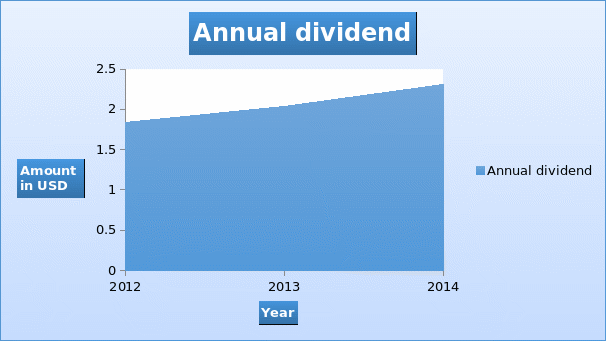
The information in the table above shows that the company pays quarterly dividends. The annual dividend improved $1.84 per share in 2012 to $2.04 per share in 2013 and to $2.31 per share in 2014. Based on the growth stages of a company, payment of dividends is only possible once the entity has reached maturity stages. Thus, Deere & Company is a fully developed company and that explains why it is in a position to pay dividends on a continuous basis. The graph presented below shows the trend of the annual dividend payment during the period.
Ratio analysis
The reported financial statements do not give an in depth analysis of the strengths and weaknesses of the company. Therefore, it is necessary to carry out an extensive evaluation of the financial statements so as to have a better view of a company. Analysis of a company helps in making informed decision. Ratio analysis breaks down the financial data into various components for better understanding of the financial standing of the entity. Ratios measure different attributes of performance a company. In the case of Deere & Company five ratios will be computed and the results will be analyzed. The table presented below shows a summary of the ratios.
Current ratio gives information on the liquidity of the company. There was a general decline in the current ratios of the company. The ratio dropped from 2.24 in 2012 to 2.05 in 2013. It later rose to 2.17 in 2014. The values of the ratios were high because the current assets can adequately cover the short term liabilities. Thus, it can be observed that the company can adequately pay the short term obligations using current assets. This shows that the company has a sound financial standing. Further, it can be observed that the values of the current ratios were lower than the industry average. The values of the quick ratio also followed a similar trend. The values dropped from 1.97 in 2012 to 1.83 in 2013 It later rose to 1.97 in 2014. The values were high and it implies that the company can easily pay short term liabilities using quick assets. However, the quick ratios were lower than the industry average. In this case, Deere & Company has a favorable liquidity position (Abdullah & Ismail, 2008).
Reflectively, “earnings per share serves as an indicator of a company’s profitability” (Abdullah & Ismail, 2008, p. 31). It is an important ratio that needs to be evaluated carefully before investing in a company because the ratio is an integral component in the estimation of the intrinsic value of share prices. Therefore, “in order to calculate EPS, it is prudent to take the total net income and divide it by the number of outstanding shares of the company” (Brigham & Ehrhardt, 2010, p. 19). However, an analyst needs to be concerned about the possibility of manipulation of earnings. Such manipulations can significantly affect the earnings per share. The earnings per share for the company improved from $7.63 in 2012 to $9.09 in 2013. The value dropped to $8.63 in 2014. Further, it can be observed that the value is significantly higher than the industry average, that is, 0.68. This implies that the company’s earnings per share is much better than the position in the industry. The number of outstanding shares has a significant influence on the earnings per share. Therefore, it is important to evaluate a number of valuation ratios before arriving at a decision on whether the shares are undervalued or overvalued. Thus, in terms of earnings per share, the performance of the company is favorable (Abdullah & Ismail, 2008).
The price earnings ratio is an important valuation ratio. The ratio gives information on the expected future earnings. The price earnings ratio dropped from 11.3 in 2012 to 10.1 in 2013. It later rose to 10.2 in 2014. The industry average is 15.91. The ratios of the company are lower than the industry average. This implies that the expected future growth of the company is lower than the industry average. This result is consistent with the discussion above. The management of the company expected the performance of the company to drop significantly in the future. This can be attributed to a number of factors that are discussed in the section above. The ratio on its own cannot adequately provide information on the future performance of an entity. Therefore, it needs to be analyzed alongside other ratios. The price earnings ratio of the company is not favorable (Brigham & Ehrhardt, 2010).
The debt to equity ratio provides information on the leverage level of a company. The values of the ratio were quite high. The ratio dropped from 3.28 in 2012 to 2.10 in 2013. It later rose to 2.69 in 2014. The ratios show that the leverage level of the company is quite high. This implies that the company heavily depends on debt as a major source of financing. Further, it can be noted that the leverage level is higher than the industry average. This shows that the company is using more debt than is acceptable in the industry. The high debt level is not suitable because it reduces profit that is attributed to shareholders. In addition, it reduces the ability of the company to access more debt facility (Siregar & Utama, 2008).
Risk and strategies
Risks
The risk level of the company is considered to be medium. This can be attributed to the fact that the revenue of the company high depends on interest rates, macroeconomic variables and government regulations. Thus, changes in these variables have a significant impact on the revenue and the bottom line. As mentioned above, the company also offers financial services to its clients. Thus, a fall in the interest rate can significantly affect the revenue generated from financial services. Government regulations can affect the amount of revenue. For instance, changes in fiscal, banking, and monetary policies affects the company negatively. A number of economic variables can affect the bottom line of the entity. Examples are exchange rate and the Euro zone crisis. For instance, in 2014, the company lost about $1billion as a result of exchange rate. Also, since the European market accounts for about 20% of the revenue generated by the company. Thus, the crisis and unfavorable trade laws can affect the bottom line of the company. Further, from an economic point of view, changes in global demand for food and several varieties of bio-energy is likely to affect the prices of farm input and the demand of products manufactured by Deere & Company. Finally, the expected negative performance in the future and the high leverage is likely to reduce the ability of the company access funding. It will also increase the cost of funding for the company.
Strategies
One strategy that the company can use to minimize the perceived risk is by diversifying their product lines. This will reduce the risks associated with the production of agricultural and construction equipments. The company can also consider vertical integration as a way of minimizing the risks associated with government regulation. The company will do in-house production, branding, advertisement, and logistical support in order to benefit from government policies. The third strategy is market expansion and improving the presence of their brand globally. This will reduce over reliance markets such as the European region. The company can also consider relocating their production plans to nations with attractive government regulations on businesses such as India or China. Finally, the company can also outsource as a way of managing risks that are associated with strict government regulations on production.
Recommendations
In the discussion above, it is established that the overall financial position of the company improved over the period. Also the stock prices are fairly stable. Also the company paid dividends during the period. The ratios analysis shows that the company has a favorable liquidity position and high leverage level. The earnings per share is high while the price earnings ratio is low. Further, the company has a strong brand name that it has built for over 170 years. Despite having been in the industry for long, the management is still committed to grow performance. Therefore, an investor should consider purchasing the stock of the Deere & Company.
References
Abdullah, A. & Ismail, N. (2008). Disclosure of voluntary accounting ratios by Malaysian listed companies. Journal of Financial Reporting and Accounting, 6(1), 1-20.
Brigham, F. & Ehrhardt, M. (2010). Financial management theory and practice. USA: Cengage Learning.
Magee, D. (2005). The John Deere way: Performance that endure. New York, NY: John Wiley & Sons.
Siregar, S. V. & Utama, S. (2008). Types of earnings management and the effect of ownership structure firm size, and corporate-governance practices: Evidence from Indonesia. The International Journal of Accounting, 43(1), 1-27.
Steven, B. (2007). Financial analysis a controllers guide: Financial analysis. New York, NY: John Wiley & Sons.
