Introduction
Investors limit their risks by using different methodologies in buying shares.For those investors who are not huge risks takers, they use the model called Dividend Growth Model. I t has been said that this model has been proven strong, low risk and can produce long term returns comparing to the other model that investors used. To use this model, investors must be patient while their dividends were slowly increasing annually. The concept behind this model of investing is to buy a solid share with tracks of increasing dividend annually. The increase rate of dividends would likely support higher stock prices over long term as many investors were searching for attractive yields. The model is proven to be prudent since the increase of dividend rate will also increase one’s yield as a percentage of a purchase price. This kind of strategy was suitable for investors who want to protect themselves form inflation. Since dividends increase every year, the income that the investors get will also increase. Most companies who fall from this strategy were stable and large by nature.
Weighted average cost capital
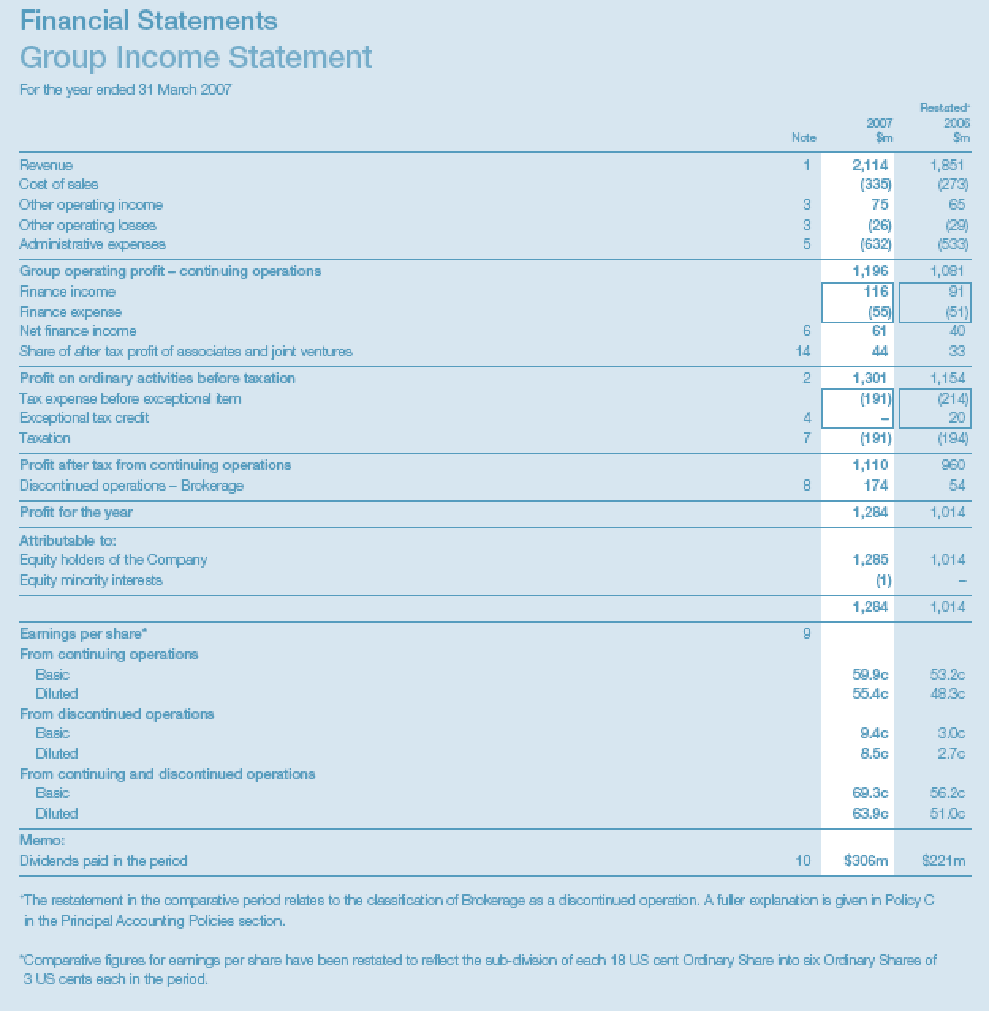
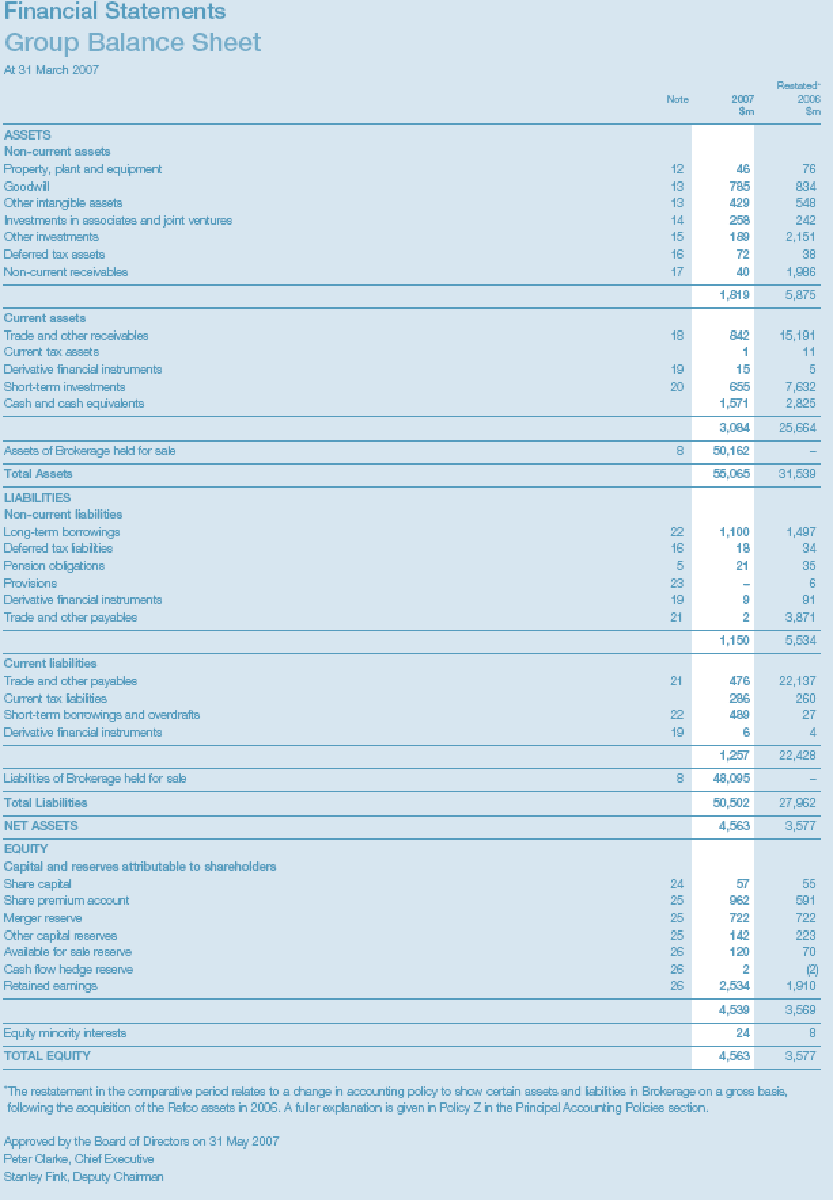
According to Brit j et al; (2006); financial analysis of a particular company analysis its past and future growth. Financial performance of the company is analyzed for the past three years in order to understand the situation of the company in the market. As per the financial report, the company has been going in loss from the past three years. The net loss as per the financial performance report is increasing every year. Similarly, Statement of financial position can also be defines as situation of the companies assets, its liabilities and owners equity. In order to calculate the owners Equity, as per the formula the total number of assets minus total liabilities results in the owner’s equity. As the company is going into losses having its equity capital reducing constantly it can be indicated that the companies share price would have significant effect because the investors in today’s market scenario would not initiate such heavy risk and not to forget that no dividend has been paid to their shareholders as well.
The cost of equity is set at the rate of 8%. This is because the growth rate of the company is expected to decline to 5% from the previous year’s growth rate of 6.5% because of the recession’s effect. The dividend is.35 which is rounded to.3 in order to come up with the rate of return required at 10%. By simple mathematical calculation for the cost of equity, the dividend rate of.3 and the growth rate at 5% mean that the cost of equity will be 8%. The before-tax rate of debt is 5% and the marginal tax rate is 36% as derived from the financial statements. Using the formula of cost of debt we arrive at the value of 3.2%. This is because.05*(1-.36) equals 3.2% as computed for the cost of debt. The final computed value for the intrinsic value of Man Group plc ’s shares comes to 189 per share which means that the current market rate of 192 per share is indeed an undervaluation of the company’s stock.
Gordon growth assumption – determine your own growth assumption for the terminal period
Footnote justification and show sensitivity range. The growth rate was based on the company’s reports that they experienced a 6.5% growth for the current year. Since there is a recession still in effect with no definite bottom, the growth can be safely expected to be at 5% only. The sensitivity of this figure is about plus or minus 0.5% since the growth rate of 6.5% was the result after the previous year’s growth rate of 7%. This was the basis by which the growth rate was determined.
Gordon Growth formula
Stock value = D/ k-G
D = Expected dividend per share one year from now
k = Required rate of return for equity investor
G = Growth rate in dividends (in perpetuity)
The nature of its business also determines the effect that they will experience from the current economic downturn. The elimination of jobs mainly from the financial sector makes the sales for electronic items and gadgets very poor also since they don’t belong to the basic need of people. Man Group plc makes a majority of its ad revenues from these electronic advertisements. The advertisements are also scaling back on their spending since there is no way that they can manage to recoup their expenses if they are to ignore the irreversible trend of decreasing consumer spending habits due to the recession. Their products are simply highly dependent on the level of income that the consumers have and the population with enough disposable income.
Their current aggressive marketing maneuvers of offering huge discounts will mean that they are going to be able to reduce the loss of attendance to their parks at a certain level. This level of attendance however, will not be big enough as the ones that the company was enjoying in times of economic boom. The huge discounts will also mean that the profit margin of the company will be suffering. They might not suffer from lack of sales but they will definitely have lower profits as long as the recession is still in effect. Analyze the valuation of peer group – create the appropriate universe of comps – please provide justification for the group you select and provide summaries and/or company descriptions for each company to support your selection.
Use of CAPM
According to Brealey, R et. al (2007); Discount rate is used to calculate present value of future cash flows. In order to calculate the Discount rate we use the Capital Asset Pricing Model (CAPM) equation.
This implies that the portfolio variance is dependent on the correlation between assets. With positive covariance there will always be some systematic/undiversifiable risk. Also, this theory does not say anything about price, returns, variances and covariance determination.
Fama & Macbeth (1973) questioned the theory’s usefulness as it is too reliant on very strong assumptions. In practice individual stocks are often not normally distributed, investors might have other considerations, e.g. a preference to minimize losses instead of maximize returns, which implies that the variance would reflect the wrong risk type. Further, the relative position of portfolios might influence decisions. Mean variance efficiency is only consistent with expected utility maximization if asset returns are normally distributed and if utility functions are quadratic. Empirically, although diversified equity portfolios and indices are often reasonably symmetric, the distribution is not precisely normal. Whether utility functions are quadratic is questionable as utility is not monotonically increasing as a function of wealth. From some point onwards, the expected quadratic utility declines as a function of increasing wealth.
The Capital Asset Pricing Model (CAPM) is an equilibrium model between expected rates of return and return covariance for all assets implicitly assuming portfolio theory and mean variance efficiency. It essentially asks: If everyone holds the efficient portfolio, how securities should be priced such that demand equals supply. The CAPM is relying on the following assumptions: no transaction costs, tradable, infinitely divisible assets, no taxes, and perfect competition, mean variance criteria (either returns normally distributed or quadratic utility functions), unlimited short sales/borrowing and lending at the risk free rate, rationality and homogeneous expectations.
re = rf + β (rm – rf)
There fore; re = 0.05 + 0.082(0.12 – 0.05)
re = 0.05574
re = 5.574%
Stockholders are mainly concerned about the earnings that will eventually pay them back as dividends from the company or on the other hand retains in the company to expand shareholders interest in the company since the firm retains the earnings.
According to Brealey, R et al. (2007); Growth rate of any particular company analysis the assets, earnings and the growing dividends in the particular financial year. Dividend discount model initiates a clear understanding of different growth rates and also the relationship between share price, rate of return and dividend is analyzed. Any particular company may have no growth, constant growth or non constant growth.
A company’s shareholders risk can be measured by the changes in its assets and equity in comparison to its debts. According to Brealey, R et al. (2007); beta is the measurement of fluctuation of a stock return for a particular period of time (financial year). Beta measures the risk of portfolio and in simple terms the higher the beta higher is the return and comprises a higher risk as well.
One of the major risks concerned for Man Group plc would be of foreign exchange risk due to its major project. Due to a lot of fluctuation in the foreign exchange market and the fluctuations in the interest rates investors are exposed to a lot of risk since the fluctuations affect their investment directly.
In order to measure the risk, a financial manager would consider to build up a financial representation of the company and the market which it operates in. this will provide a clear view of the risk assessment to the shareholder. Also, a shareholder may consider a financial risk management for their investment. According to Peirson, G; et al. (2000); Diversifying investment is one of the ways which very preferable in today’s market scenario. Diversifying investments helps the shareholder to spread their investment over a number of other investment opportunities.
The beta coefficient is another factor that must be considered. Beta measures the systematic risk that a financial asset will most likely experience in comparison to the industry average beta. A beta of one indicates that the security’s price will move with the market. A beta greater than one indicates that the company will experience wider price swings and have relatively large rate-of-return fluctuations compared to portfolios of smaller betas. A beta less than one indicate that the company will experience narrower price swings and have relatively small rate-of-return fluctuations compared to portfolios with larger betas.
Cash flow statement
Cash flow statement is also one of the vital documents which are included in the financial report of the company. According to Brealey, R; et al; (2007); Cash flow statement reflects the cash inflow and outflow of the company day to day operations. Cash flow statement includes three main activities mainly operating, investing and financing.
As per the figures, the operating activities in the year 2007was (2546801), investing 371748) and financing activities contributed 3130633 which resulted in a positive cash flow for the year of 2006 for $212084. It increased its cash flow in the continuing year of 2007 where it increased to 3398206. But for the following year the net cash flow decreased tremendously to (894948) resulting in negative cash flow and we can assume that the company might have some serious cash in hand issues due to the negative cash flow for that particular year.
According to News bite; (2008); Man Group plc price was down for 48.7% below the weighted price for the forth consecutive month.
The Discount rate which is used in analysis
The rate of return will determine whether the investment will be accepted or not. In most companies it is the expected return from asset the management intends to manage in. the company will invest in a particular asset if it is likely to generate a return that is acceptable by the institution. This is always weighted average cost of capital.
Weighted average cost of capital is one of the most tools available for managers to use in decisions making relating to long term sustainability of the firm. It is the overall process of generating, evaluating and selecting the cost of capital that will be required by an investment project.
The following assumptions are usually made;
- There is a known target ratio for the financing elements, which will continue for the duration of the investment project under consideration;
- The costs of the various elements will not alter in the future from the costs calculated ; and
- The investment under consideration is of similar risk to the average of the other projects undertaken by the business.
Then using the weighted average cost of capital (WACC) as the discount rate is logical.
Using opportunity cost implies looking at the savings in financing cost that would arise if finance were to be rapid instead of undertaking the investment project. Alternatively, it could be seen as the additional cost of raising the necessary finance to support the project. If there is a target, repayment of finance or additional financing would be carried out in accordance with the target.
The three assumptions stated at the start of this section are all concerned with the fact that in investment project appraisal, and in any other case where we may wish to assess the cost of capital, it is the future cost that we are interested in. The third assumption, relating to risk, perhaps needs a comment. We know from a combination of intuition, casual observation of real life and from a robust theoretical proposition that the required rate of return/ cost of capital depends partly on the level of risk surrounding the cash flows of the investment project concerned.
The market values are more relevant for this company because market values are determined with market forces of demand and supply. Book value can not either undervalued or overvalued shares of the company. The London stock exchange values all stocks efficiently and these stocks of this company which is not listed will have to value using the values of the market.
Also retained profit is also used as source of capital when book values are used. It has an opportunity cost to shareholders because, if such profits were to be distributed, shareholders could use them to make revenue-generating investments. It would be incorrect however to deal with retained profit separately in deducting its cost. Of a share used in dividend valuation model would reflect any retained profits attaching to the particular share. Thus provided that the cost of equity is properly derived the fact that the equity is part of share capital and part retained profit will automatically be taken into account.
Conclusion
To conclude, the company has been going in loss for the past 2 years as information provided in the financial reports. As per the analysis made previously, the company is not a better investment for shareholders since it involves a lot of risk due to being an over valued share and other risk involved would be of foreign exchange risk and interest rate risk. Man Group plc also has not provided any dividend to its shareholders for a number of years and moreover has issued 1000000 new shares in order to raise capital in the last financial year. Overall, Man Group plc is considered to be a high risk portfolio company from an investor’s point of view.
References
- Amihud, Y., & Mendelson, H. (1986). Asset pricing and the bid-ask spread. Journal of Financial Economics, 17, 223-250.
- Chan, L. K., & Lakonishok, J. (1993). Are reports of beta’s death premature?. Journal of Portfolio Management, 19, 51-62.
- Fama, E., & Macbeth, J. (1973). Risk, Return, and Equilibrium: Empirical Tests. The Journal of Political Economy, 81(3), 607-636.
- Fama, E., & French, K. (1993). Common risk factors in the returns on stocks and bonds. Journal of Financial Economics, 33(1), 3-56.
- Fama, E., & French, K. (2004). The Capital Asset Pricing Model: Theory and Evidence. The Journal of Economic Perspectives, 18(3), 25-46.
- Farrell, J., & Saloner, G. (1985). Standardization, Compatibility, and Innovation. The RAND Journal of Economics, 16(1), 70-83.
- Hirshleifer, D. (2001). Investor Psychology and Asset Pricing. The Journal of Finance, 56(4), 1533-1597.
- Markowitz, H. (1991). Foundations of Portfolio Theory. The Journal of Finance, 46(2), 469-477.
- McLaney E., (2003; Business finance theory and practice; Prentice Hall ISBN 0-273-67356-4
- Roll, R., & Ross, S. (1994). On the cross-sectional relation between expected returns and betas. Journal of Finance, 49, 101-122.
- Roll, R. (1977). A critique of the asset pricing theory’s tests: Part I. Journal of Financial Economics, 4, 129-176.
- Schlosser M.;(2002); Business finance: application, Models and cases, prentice hall, ISBN 0-13-264649-8.
- Westerfield R., Jaffe, and Jordan (2007); Corporate finance core principles and applications by McGraw-Hill. ISBN-13: 978-0-07-353059-8/ISBN-10:0-07-353059-X
- White G I Sondhi E C & Fried D (1999): The analysis and use of financial statements Wiley
Appendix 1 : income and expenditure