New Balance is on the cusp of several new projects that span six and three years, respectively. The first project is related to the release of sneakers aimed at an audience from 12 to 18 years old among men. The face of the marketing campaign will be Granada’s Olympic runner Kirani James, who won gold in the 400 meters, becoming the first non-American to reach the summit. This project requires the deployment of a factory in Vietnam a lot of operating costs. The second project is designed for a more solvent audience and can be developed in the hiking sector, which is experiencing an increase. For this project, it is possible to use an existing factory experiencing downtime, which will increase the profitability of the company’s assets. Each project has its pros and cons; this work aims to evaluate all possible alternatives and suggest the most appropriate one. The paper presents an analysis of the company’s state, analysis and calculation of a set of financial indicators for each project, and analysis of decisions on this situation.
Introduction
New Balance is a sports shoe company with over a century of history. The company’s revenue has grown steadily over the past twenty years, posting higher levels in the Summer Olympic years and returning to a stable growth rate after that (New Balance Financials, 2022). New Balance has always prioritized quality over quantity and has been an innovator of sports technology in footwear. The company’s factories are present all over the world; products are often presented as sponsors for many important events in the world of sports: the Olympic Games, the NBA, the Australian Football League (Our goal is to help you achieve yours, n.d.). At the same time, New Balance is surrounded by a host of other strong competitors represented by Nike, Reebok, Adidas. The athletic shoe industry is showing growth in financial terms, despite forecasts.
New Balance also meets the environmental and social responsibility requirements that any large company must meet. For the sake of reputation and the environment, the company manufactures 100% recyclable boxes and uses environmentally friendly technologies in production (Sustainability, 2022). However, at the same time, there is no evidence from the company about reducing greenhouse gases, using freshwater, and another emphasis on essential issues in any production. On the other hand, the company employs more than five thousand people; the team encourages creativity, diversity, tolerance, which is reflected by the introduction of the policy on the work-time balance program. However, to maintain stable growth, it is needed to put in much effort, holding on to the market presence through marketing the quality of new technology in shoes, which competitors constantly stimulate.
Technological externalities indicate a company’s competitiveness in a given industry. Other competitors in the face of Nike, Reebok show advanced developments from a higher price category at the expense of brand and quality. New Balance is a more affordable product, which is a definite plus for a younger audience. However, at the same time, these products also need to keep up with the ever-evolving technology trends to maintain their position in the market. The older audience, which is often the parent of a younger first-project target audience, very often values quality over price, which requires New Balance to invest in R&D continually.
New Balance is affected by external environmental factors just as much as its competitors, but the strongest players in the market have a firmer financial footing. The company has the funds to launch both projects, but the risks are doubly increased due to the enormous costs at the first stage and subsequently, which must be offset by high sales. If the company has relevant experience in the sports footwear market, then its products will be introduced to the hiking footwear market for the first time, which makes risk management the most responsible task.
The company is on the verge of a decision on two projects. The first of them is more challenging to implement, but it is planned that the company will be able to maintain growth, be able to win an audience from 12 to 18 years old among men, and fully recoup all the costs necessary for the project. The second project was not so long in implementation; however, according to Rodriguez, it is much more reliable in this situation. It is aimed at an older audience, is a new market for the company, will not affect sales of other shoes, and also does not require the construction of a factory. A more detailed analysis of these two situations requires financial analysis. Reputational and ethical discussions regarding these two projects concern the following.
By bringing in Kieran James as the face of the company for the new project, New Balance will have a strong personality, a professional athlete as an ambassador, much like Usain Bolt represents Puma. For the next six years, if Kieran James succeeds at the upcoming Olympics, he, along with the company, will gain many young fans. For the reputation of New Balance, this fact can be decisive in choosing the first project over the second. On the other hand, the Persistence project does not provide such reputational solutions, making it possible to enter a developing market sector with a quality product, where quality plays a decisive role. The second project will provide an opportunity to optimize the company’s existing resources, while the first one will increase them.
Financial Analysis
Table 1. Initial Financials for Sneakers 2013
Table 1 reflects known information about this project. Based on this table, calculations were made of the most important indicators of the project’s cash flow for each year of its implementation, as well as NPV and IRR indicators. NPV is a financial indicator that shows the expected future income of a project minus its initial cost. Simply put, NPV compares current money with future money that will cost less due to inflation (Arjunan, 2019). IRR, in turn, is a tool that calculates the discount rate at which the investor will receive back all investments; that is, it will go to zero, taking into account the time value of money (Arjunan, 2019). These indicators are vital in evaluating any project, as they can reflect its profitability in advance using the information provided.
The project’s cash flow makes it possible to trace the profit and loss collected together, taking into account all expenses, taxes, and income. Table 2 presents the calculation data entered in a single table for ease of viewing. It should be noted that the first and last years are unprofitable for this project due to the relatively high cost of the initial investment. At the same time, NPV never goes negative, which gives this project an advantage, especially against the background of its reputational advantages. A positive rate of return, in turn, requires that the IRR be above 10-20% in order for the project to pay off. The IRR remains high enough according to these calculations that it can be concluded that this project is highly likely to pay off, even despite the possible profit from the sale of factories and equipment, which were not included in this calculation. The profit is 102 and 3 million respectively.
Table 2. Calculated Financials for Sneakers 2013
Table 3. Calculated Financials for Persistent
Similar calculations were made for the Persistent shoe line in Table 3. Its advantages are that this production does not require the cost of purchasing a factory, the sector is more developing, there are fewer marketing costs, and the target audience is more solvent. The calculations were made for the same number of pair sales as for Sneakers 2013, considering the growing percentage of industry development. Here NPV is also positive and reaches high values by the second year and does not fall further. At the same time, the IRR is even higher, which makes both projects profitable at about the same level. Since the obtained values of the project’s cash flow, as well as NPV and IRR, turned out to be approximately at the same level, it is also necessary to compare such indicators as inventory, accounts receivable, and accounts payable. However, according to the case, they will be fully restored by the end of the sixth and third years of the projects, respectively. In the case of the first project, the mentioned values will grow much faster, as they depend on variable costs, which are 17% higher than the same indicator for the second project.
Given the positive dynamics of these projects, it is worth considering an alternative in terms of financial indicators when two projects are being carried out simultaneously. To do this, it is needed to add up all the calculated costs and estimated income and calculate the dynamics of NPV, IRR, and project cash flow for both projects at once. This approach is attractive because the company will gain a celebrity for marketing purposes, improve its reputation and at the same time enter a new market for itself. Significantly increase the initial investment in both projects at once, which can significantly affect the company’s overall financial performance, but the expected profit should fully cover these incomes. Table 4 provides a 6-year estimate for Sneakers 2013, based on a 3-year Persistence project – other sales figures have been taken based on market growth rates from years 3 to 6.
Table 4. Two Projects Calculated Financials
These calculations showed a much higher NPV but with a lower IRR. Interpreting the data, we can conclude that when working with two projects at once, certain risks increase: the company has a significant increase in receivables and payables, and it is also required to allocate 230 million instantly, which is an impressive amount for the company, given the expected turnover. Expected future income rises significantly and is no longer negative in either the first or last year, showing a positive growth trend up to a spike during the Olympics.
Based on financial indicators, one can conclude that these projects are profitable and liquid, all of which are positive to a certain extent. The following section will analyze the main pros and cons of each strategy, which are associated not only with financial indicators but with a focus on the possible calculated profit from them. Each of the three options should be considered for application by company management. The option of abandoning two projects is not considered, as the company risks losing the opportunity to develop increased assets and use current resources.
Alternatives
Financial quantitative analysis showed three possible alternatives for the company’s development concerning project management. Either New Balance focuses on the Sneakers 2013 project, leaving Persistence out, or vice versa or both projects begin to develop simultaneously. Each of the possible alternatives carries certain limitations and risks, due to which a deep analysis is required to select the most suitable option for the company.
The launch of the Sneakers 2013 project is significant for the company in terms of reputation and market presence. This project has a more upfront cost than the second project, but it has a more elaborate marketing plan. New Balance will be partnering with Kirani James, a rising star in the running who has already won over fans and audiences by winning gold at the Olympics. Given the athlete’s youth, the company can arrange fairly profitable cooperation. Kirani James has already become an idol for many of the younger generation, as he was able to achieve gold for a country that had never won such a pinnacle in the Olympics before.
In addition, the company implements the best technological developments for these sneakers, with a complete plan already in hand with the deployment of a factory in Vietnam and related equipment. The ultimate clarity of what was conceived is supported by calculating the number of pairs sold, taking into account all costs. Despite the high initial investment cost, the project promises to pay off and gives an excellent financial performance. Pricing is also an asset to this project, with competitors listing new tech designs for over $300 a pair at retail. New Balance can keep the price of $190, which opens up the opportunity to enter the markets of developing countries, where such an advertising campaign will be especially relevant.
However, the project looks more impressive than quantitative indicators showing apparent losses in the first and last years. The preliminary analysis of the project was much more complete, including the opinions of manufacturers, financiers, marketers, and other experts from various fields. Persistence does not have such a detailed analysis, which is the first and significant disadvantage of the second project. Sneaker 2013 has been worked out more closely, which makes its financials look more reliable, excluding various risks, except for a few. These include the weak performance of Kirani James at the 2016 Olympics, which may significantly reduce the attention to this athlete from fans, the media, and other professionals. There may also be low sales compared to competitors, with a possible significant drop in revenue due to lost sales of other sneaker lines. At the same time, the performance of Kirani James is beyond the control of New Balance, which is why they can manage this risk only by creating a contingency plan in case of poor sales.
By following through on the adoption of the Persistence project and dropping Sneaker 2013, the company will have a product line in a new market. The advantages are that this market is rapidly gaining momentum in sales, showing growth rates of tens of percent. It would be unforgivable for this company to miss such an opportunity. New Balance, however, has no sales experience in this particular area, forcing them to pay $50 million for the design technology and appearance of the shoe to an outside source. In fact, in this way, the company becomes dependent on a third-party carrier of this information. While New Balance will be responsible for the direct production of the footwear, the development complexity could create additional risks whose impact can only be assessed long after the project has been launched.
On the other hand, the company may increase the liquidity of spending on one of its factories where new shoes will be produced. The company will incur the costs regardless of the acceptance of the project, which will be visible with the initial investment in Sneaker 2013. Powering the factory, the company should spend only on new equipment, the experience with which will also be indispensable for New Balance as part of its entry into a new market. The target audience of this product is a relatively wide range of both men and women from 25 to 40 years old, which is the most solvent audience, in contrast to the audience of the Sneaker 2013 project. In this case, the presence of their real estate frees companies from the need to sell it, as in an alternative project. The NPV indicators, in this case, are much higher, as shown by quantitative analysis. Finances in this project move more reliably and do not predict all kinds of negative values in any of the years.
The shorter period of this campaign makes it possible to launch another project in the future based on the work done, focusing on sales from this project. Persistence is extremely promising in the long term to capture the hiking shoe market at an affordable price. However, it is currently poorly developed, in contrast to Sneaker 2013, which may result in risks and financial difficulties that were not considered in the initial superficial analysis. New Balance management is interested in the more reputable Sneaker 2013 project, which promises a big name for the product in the market instead of stable and quiet development in the hiking shoe market. Accordingly, marketing costs differ: in the case of Persistence, a separate model is not so important, but a possible choice and a wide range for the whole family. Good quality shoes will be bought in two, three, or four copies, as the target audience is young and active families. However, this alternative is unlikely to find supporters in its management, which may complicate its implementation.
The third alternative combines the pros and cons of each of the above options. The opportunity to partner with a young sports star and enter a promising market is a promising approach for New Balance, but the project’s initial costs are greatly multiplied, especially when combined with risks. Companies need to spend almost $250 million in a one-time and instantaneous way, which is almost a tenth of their revenue (New Balance Financials, 2022). As a rule, these costs are too high for the company, given that not all of the proceeds are on hand that can be spent. The company’s net revenue is relatively low due to the gross profit ratio, equal to a high figure of 40%. In this regard, financial risks now have a significant impact on the progress of this project. Although the financial performance has generally demonstrated high NPV values, it is still risky to choose this path.
At the same time, finances can be regulated by more extensive sales of Persistence, which offset the negative NPV from Sneaker 2013 in the first year. The company will gain a presence in an important market while remaining competitive in its core athletic footwear business. Perhaps this approach requires more thoughtful and lengthy analysis. However, New Balance benefits from this case much reputation, monetizing in other product lines. This alternative also offers a more profitable option for families: most often, the audience of 12-18 years old among men is the children of the Persistence target audience. The implementation of the project may require a higher share of borrowed funds than just the sum of the debts of both projects, which also introduces additional risks. Finally, this alternative for the next three years of performance evaluation will not allow the company to start new projects.
Solution
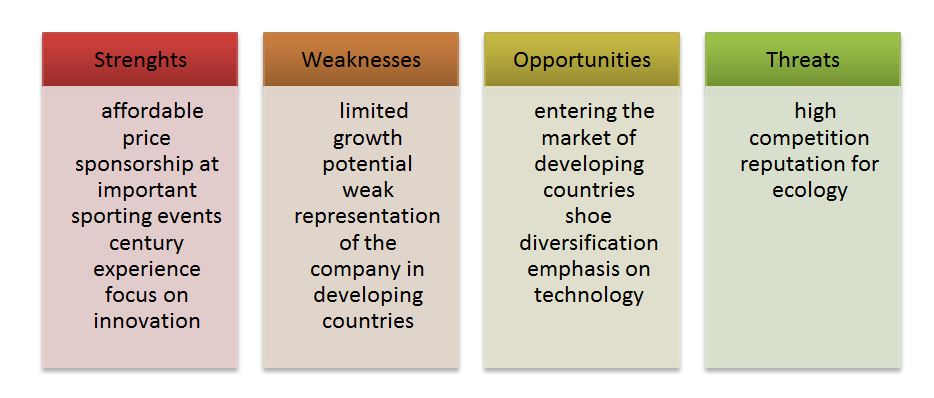
To make decisions, it is necessary to refer to theoretical concepts, particularly the SWOT model, which reflects the internal strengths and weaknesses of the company. The strengths lie in an affordable price compared to competitors, sponsorship of the world’s most important sporting events, a century of development experience, and a focus on innovation and technology. The fundamental distinguishing feature from the competition is the price of New Balance sneakers: even a high-profile project like the Sneaker 2013 implies a relatively small price compared to the flagships on the market: 190 versus 315. At the same time, New Balance is poorly represented in emerging economies, where the Sneaker 2013 project, namely marketing involving Kirani James, would be the most relevant and inspiring. Finally, another weakness of the company is its low gross profit ratio, typical for the entire industry, and, as a result, limited growth potential.
The opportunity lies in the diversification of shoes into new sectors, especially the most promising ones, since the loss of time, in this case, is an opportunity for competitors. In addition, high brand awareness can be a driver of sales growth in markets in developing countries, as an affordable price compared to well-known market representatives can play a decisive role. Finally, focusing on technology will help keep the company competitive and offer future-proof solutions in the still-developing hiking shoe market.
The threats lie in the more technological solutions of competitors, who can receive more profitable corporate offers from sports clubs. In addition, New Balance’s environmental responsibility is currently limited to the manufacture of boxes and products, with no more global and far-reaching goals. The reputation of a company that can be earned through hard work and cost during the Sneaker 2013 project could be significantly damaged by environmental issues. Therefore, from the possible alternatives, it is needed to choose the one that uses the majority of the strengths and capabilities of the company, leveling the weaknesses and preventing threats. The SWOT analysis of New Balance is shown in Figure 1.
Therefore, the most promising solution is to launch Sneaker 2013 and Persistence simultaneously due to the company’s limited growth potential. If New Balance does not seize the opportunity to enter a new market now, revenue will be limited to about the rate of growth of the industry, and sooner or later, the company will reach a crisis, due to which it will lose the competition to the stronger Nike, Reebok, and Adidas. In parallel with this, it is necessary to develop its presence in emerging economies, emphasizing the need to use a marketing plan with Kirani James. Coupled with the affordable pricing of a diversified line of shoes, the company will have plenty of room to grow with its current competitiveness. Finally, in emerging economies, there are usually many more environmental or social issues that New Balance can address in order to improve its reputation in this area, eliminating one of the main threats to its business.
Conclusion
In this paper, we consider the case of New Balance, which is on the verge of two projects. As a result of financial and qualitative analysis, using the SWOT methodology, it was decided to launch both projects, despite all kinds of financial risks, due to its limited growth potential. New Balance has achieved worldwide recognition in over a hundred years of its activity. The new challenges are an opportunity to expand the business in an industry already heavily occupied by mass-market name brands, some of which have more powerful brands and higher sales than New Balance. The two projects provide an opportunity to significantly support its operations and give the company an impetus to develop in a new market. Financial indicators indicate high risks in case of failures; however, they show a positive trend with calculated sales. As a result, the company will be able to develop its financial activities in the long term improve its reputation and its presence in the market.
References
Arjunan, K. C. (2019). Non‐monotonic NPV Function Leads to Spurious NPV s and Multiple IRR Problems: A New Method that Resolves these Problems. Economic Papers: A journal of applied economics and policy, 38(1), 56-69. Web.
New Balance Financials. (2022). Web.
Our goal is to help you achieve yours. (n.d.) New Balance. Web.
Sustainability. (2022). New Balance. Web.