Executive Summary
UG IT Consulting Company will be based in Sydney, Australia, and will provide standard and world-class IT consulting services. Our services will include: supplying technology to consumers (current module phones, laptops) and supporting software to meet our client’s specific needs, planning, design, and development of computer or network systems, computer systems and design, development. Also, computer application design and development, IT technical support, IT technical consulting services, and other specialized services. Our client’s best interests will always come first, and our principles and professional ethics will guide everything we do. We will ensure that we hold ourselves to the highest standards by precisely and addressing the needs of our clients.
Introduction
Zen Enterpriser Company needs durable and long-lasting current mobile phones for all employees to deal with the latest technology works.
Number of employees: 25.
Proposed Solution
Multiple communication choices: We will provide you with a variety of communication alternatives from which to pick.
We will recommend one mobile phone. Comparing the iPhone 13 against the Samsung 21 and then propose the ideal phone for your business.
We will demonstrate a comparison of two distinct mobile phone models, including pricing, durability, and certain features.
Company Characteristics
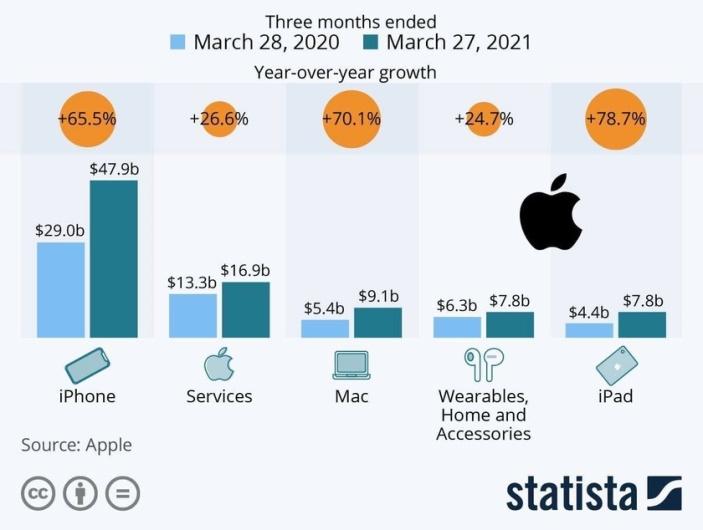
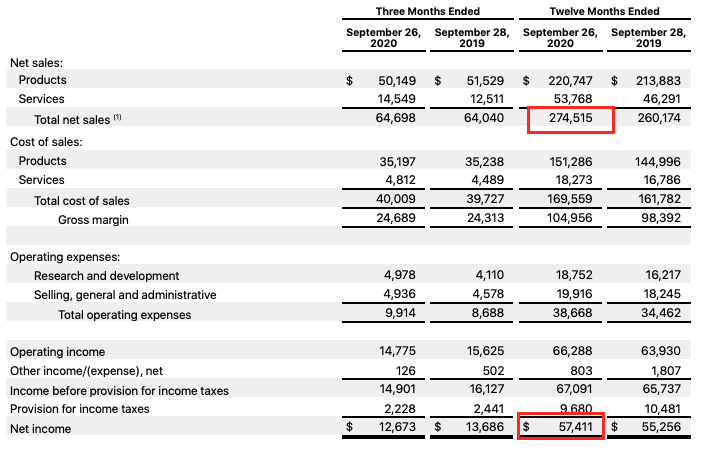
Apple earned $274.52 billion in revenue in fiscal 2020, up from $260.17 billion a year earlier. Product sales increased from $213.88 billion to $220.75 billion, and the service business (App Store, iCloud, iTunes, Apple Pay, etc.) went from $46.29 billion to $53.77 billion. The primary source of income Apple remains smartphones. Sales of iPhones in fiscal 2020 were $137.78 billion, down from $142.38 billion a year ago (SAP, 2021). The decline was because users were waiting to release new models, but it was delayed because of the pandemic coronavirus COVID-19. Computer shipments brought in $28.62 billion in annual revenue for Apple, up from $25.74 billion a year earlier (Apple, 2021). In the tablet market, its revenue climbed from $21.28 billion to $23.72 billion, and its wearable electronics, home gadgets, and accessories division registered sales growth from $24.48 billion to $30.62 billion.
As for the regions, the lion’s share of Apple’s sales is still in North and South America, where the corporation earned $124.56 billion in 2020 compared to $116.91 billion in 2019 (Zysman and Tyson, 2019). In Europe, sales also increased – from $60.29 billion to $68.64 billion. But in China, Apple’s revenue declined year over year (from $43.78 billion to $40.31 billion) and in Japan (from $21.51 billion to $21.42 billion).
On the day of publication of its annual financial statements, Apple’s shares fell by 4.22% in electronic trading after the close of trading (Statista, 2021a). As a result, the company’s market capitalization in one day dropped by almost $100 billion. Quotes fell due to lower revenues in China, and those iPhone sales fell short of market expectations.
Thus, the general trends of the company can be called the following points:
- Annual increase in sales volume and profit of the company. Firstly, it is explained by the expansion of customer base, secondly, the addition of product value, and thirdly, improvement of products both technically and aesthetically, arousing interest. For example, one of the latest marketing moves made by the company was the introduction of several previously missing colors for the phones and after that, sales grew by 5%.
- The delay in launching new models is directly related to the company’s falling sales. According to the results of the second quarter of 2020, it is noticeable that iPhone sales declined due to the late release of new smartphones (Table 2).
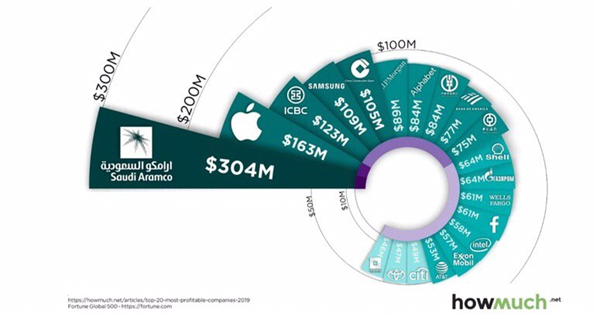
- The company is in the top 20 richest companies in the world for 2019. It continues to increase its profitability, which shows the trend of the brand development and maintains a prestigious place among competitors (Table 3).
Comparison with Samsung
For a more objective analysis of Apple’s performance, comparing the company with an equally powerful electronics competitor is necessary. Over the past decade, Samsung and Apple have repeatedly stood at the top of the global rankings of mobile device manufacturers. But they are very different companies, with very different approaches to what smartphones should be and how business should be done.
When were the companies founded?
Samsung: March 1, 1938, in Daegu, South Korea (Samsung Newsroom, 2021).
Apple: April 1, 1976, Cupertino, California, USA (Apple, 2021).
Number of employees
Samsung: 320,671 employees (as of December 2017) (Samsung Newsroom, 2021).
Apple: 132,000 full-time employees (as of the end of the fiscal year 2018) (Statista, 2021a).
Market share
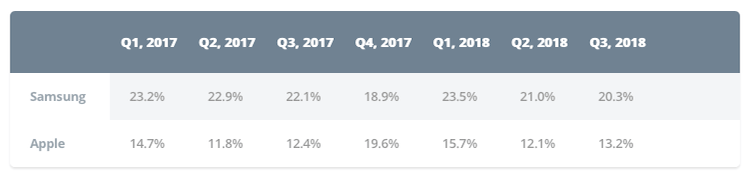
Samsung had the largest market share in the first quarter of 2018, while Apple had the largest market share in the fourth quarter of 2017 (Table 4).
Best-selling phone
Samsung: E1100, 2009: 150 million units. Galaxy S4, 2013: 80 million units (Statista, 2021b).
Apple: iPhone 6 and iPhone 6s, 2014: 220 million units (Statista, 2021a).
Largest acquisition
Samsung: Harman International Industries, 2017: about $8 billion (Statista, 2021b).
Apple: Beats Electronics, 2014: about $3 billion (Statista, 2021a).
The value of the latest flagships released
Samsung:
- Galaxy S10: $899.
- Galaxy S10 Plus: $999.
- Galaxy Note 9: $999.
- Galaxy S9: $719.
- Galaxy S9 Plus: $839 (Statista, 2021b).
Apple:
- iPhone XS: $999.
- iPhone XS Max: $1,099.
- iPhone XR: $749.
- iPhone X: $999.
- iPhone 8: $599.
- iPhone 8 Plus: $699 (Statista, 2021a).
Table 5. Recent earnings.
As a result of comparing some characteristics, the conclusion is that Apple’s campaign is more profitable than Samsung’s policies and activities in an overwhelming number of criteria. Firstly, Apple’s revenues have been consistently higher than Samsung’s in all three years (Table 5). Secondly, the staff of the American company is several times smaller than that of the Korean company, which suggests that Apple’s personnel costs are lower while its revenue is higher. This testifies to high professionalism and demanding recruitment criteria. Thirdly, Apple spends less but earns more compared to Samsung. This can be seen in the graph of the most significant devices, the slight difference in the cost of flagship products, and the percentage of market share.
Sensitivity Analysis
The next billion smartphone and tablet users will be much more price-sensitive than the first billion. At the moment, the number of smartphone users has reached 1 billion, and 6 billion cell phones. Now the increase in the smartphone market will go at the expense of the less well-off people on the planet, so the price of the device will be more and more critical in the competition.
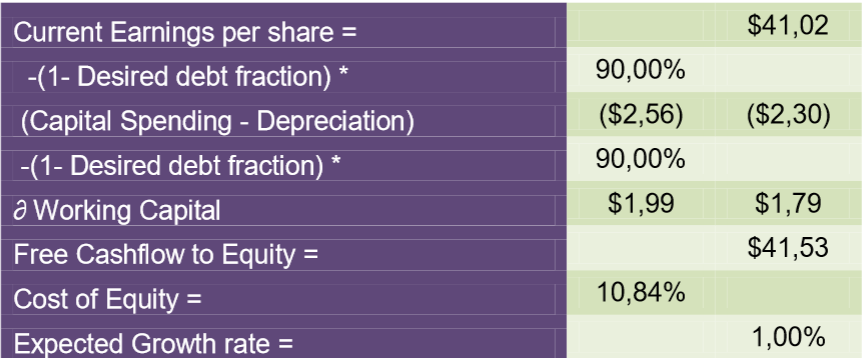
Expected free cash flow current earnings per share = $41.02 -(1- Desired Share of Debt) * 90.00% (Capital Outlay – Depreciation) ($2, 56) ($2.30) -(1- Desired Share of Debt) * 90.00% Working Capital $1.99 $1.79 Free Cash Flow to Equity = $41.53 Cost of Equity = 10.84% Expected Growth Rate = 1.00% (SAP, 2021).
Table 7. Stock valuation.
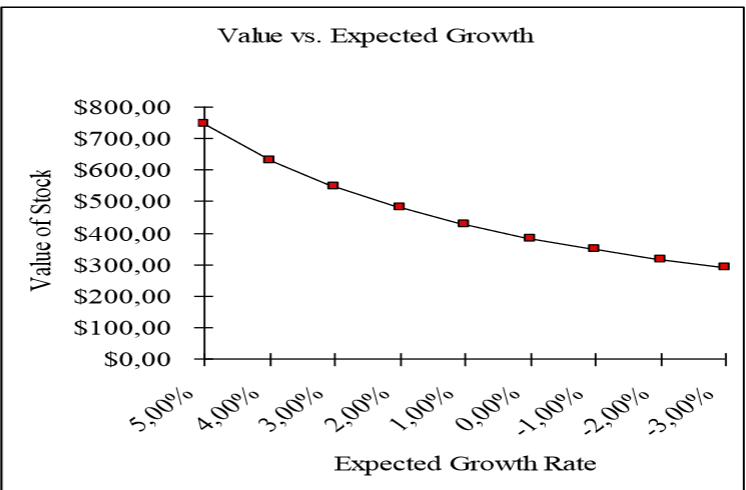
The sensitivity analysis of the change in the cost of equity to the growth rate in a stable period is shown in Fig. 1. The cost of capital remains unchanged.
Conclusion
In summary, the conclusion is that Apple’s sensitivity has not changed. Even though the first billion phones have been sold, and in theory, the actual consumer should switch to the less affluent segments of the world’s population, this will not happen. This is explained by the frequency of release of new products, the introduction of innovative technologies, and the stability of release dates that have contributed to changing the technology every year for a newer one. Apple’s policy also promotes it in exchange programs, the possibility to return within a year, and the environment protection course, the essence of which is to reduce the amount of discarded products from the company.
Reference List
Apple. (2021) Apple newsroom. Web.
Howmuch. (2021) The largest brands of the world 2020. Web.
Samsung. (2021) Samsung newsroom. Web.
SAP. (2021) Products analytics overview. Web.
Statista. (2021a) Apple – statistics & facts. Web.
Statista. (2021b) Samsung Electronics – statistics & facts. Web.
Zysman, J., and Tyson, L. (2019) American industry in international competition. Government policies and corporate strategies. Cornell University Press.