Introduction
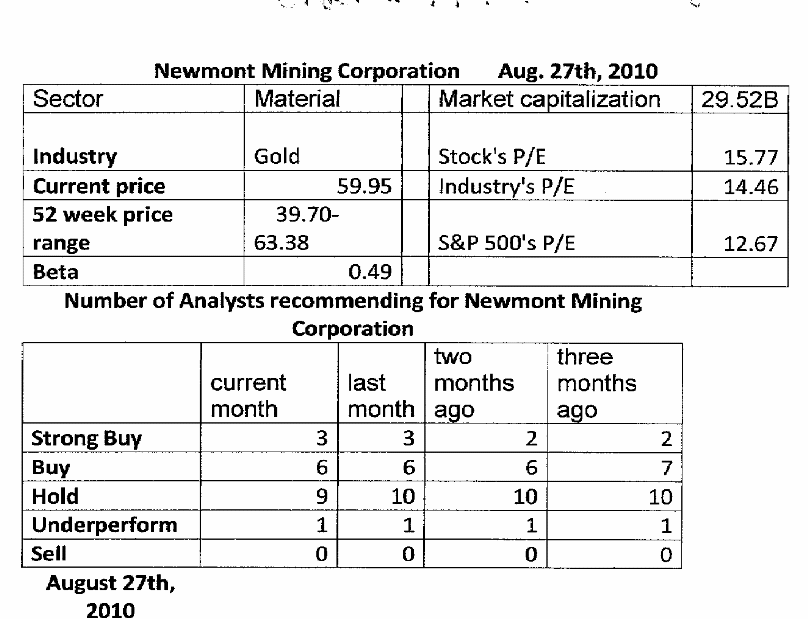
This paper seeks to write an analysis of Newmont Mining Corporation based on the data table listed in Appendix A. This paper will serve as a stock report that advises investors as to whether possible investment decisions with the company.
What does the company do? What are their major divisions?
Newmont Mining Corporation (or “Newmont”) is engaged in gold production. It employs its assets in many parts of the world in its operations, including the United States, Australia, New Zealand, Peru, Canada, Indonesia, Ghana, and Mexico. It produces copper, principally through its Batu Hijau operation in Indonesia and Boddington operation in Australia. The company is reported to have proven and probable gold reserves of more than 90 million equity ounces and a total land position of more than 33,000 square miles as of the end of 2009. It has made some investments to its competitor, namely AngloGold Ashanti Ltd.
Its major divisions are related to its reportable segments, which are based on its organizational management structure, as focused on geographic regions. Thus, major divisions may refer to those in North America, South America, Asia Pacific, and Corporate and Other.
Who is the competitor?
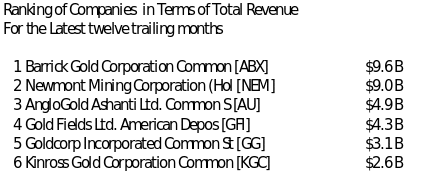
Its competitors in the gold mining industry include AngloGold Ashanti Ltd., Barrick Gold Corporation, and Gold Fields Ltd.. The company is one of the leaders in the industry by ranking second in terms of total revenues for the latest twelve trailing months. See Appendix C. Its having invested in one of its competitors reflects the strategy to the company to maintain its global status.
What is the company’s strategy?
Newmont pursues a strategy of increasing its stock price valuation in relation to an increasing price of gold. It specifically wants to enhance the profitability and sustainability of its business by aggressive exploration and development of its best gold and copper assets while it pursues accretive gold and copper acquisitions. It also wants to continue refining its planning and execution capabilities via innovation and improvement initiatives on its business processes. It further wants to improve safety, social and environmental responsibility. Its decision to employ these strategies is geared toward its continued operation across the globe.
How do analysts feel about the company?
The analysts feel that the company’s stock is undervalued based on Appendix A. The fact that analysts are recommending hold and buy and strong indicates that stock prices are expected to go up in the future, and therefore the stocks are deemed undervalued.
How has the company performed over the past year (e.g., earning, sales?)?
The company has performed well over the past year in terms of increasing revenues and profits in absolute figures and in terms of increasing profitability ratios. Total revenues amounted to $7.7 billion in 2009 from $6.1 billion in 2008, with an increase of over a billion dollars. Net income increased to $2.1 billion in 2009 from $1.7 billion in 2008. By dividing the net income with the respective revenues, this would mean that the net profit margin in 2008 was 19%, and it increased further to 27% in 2009.
How has the stock performed over the past year?
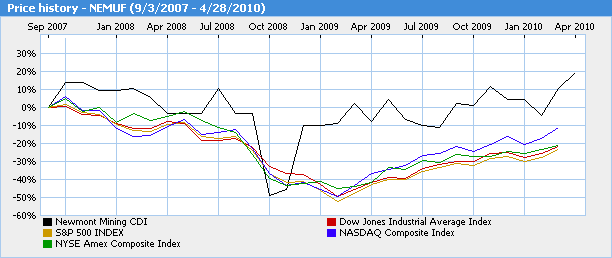
The stock of Newmont appears to have performed well for the past year by comparing the behavior of its stock price in relation to major stock indices. See Appendix B. It outperformed the indices for several years except at a certain in 2008.
Is the company’s stock is undervalued (i.e., a good buy) or overvalued (i.e., a bad buy)? Why?
The company’s stock is undervalued because of the strong recommendation of analysts for buy, strong buy, and hold. It would mean that stock prices are expected to go up in the near future. Another proof that it is undervalued is the fact that it still has lower price-earnings (PE) ratio of 16.17 for the latest twelve trailing months as against the industry average of 27.77 despite the company having a higher operating margin than that of the industry. The company exhibited a 42.75 operating margin as against the industry average of 20.65% for the latest twelve trailing months. This means that the company has not realized its full potential and that stock prices could still go up because it is more profitable than the industry average and yet the industry expects to produce higher PE ratio.
This argument is based on the premise that profitability is expected to produce better stock prices because, from the point of view of an investor, it could mean high expected cash inflows, and when discounted mathematically, the same would produce higher net present value, which would mean higher stock prices for the company in the future. The industry average is being used as a benchmark since it could represent what a company in the industry could attain on average.
Conclusion/ Recommendation
The profitability of Newmont is clearly demonstrated, and company strategy appears to attain the company’s target realistically in terms of further increasing stock prices for the benefit of stockholders. The analyst recommendation is consistent with the analysis made by this researcher that the company’s stock is undervalued. Willing buyers can choose, therefore, to buy, and present stockholders should wait for some time before they should sell their investment as stock prices are expected to increase in the future.
Appendices
Appendix A – Data Table as Given

Appendix B – Stock Price Graph

Appendix C

Works Cited
“2009 Annual Report”. 2010. Newmont. Web.
“Company Report – Newmont”. 2010. MSN. Web.
“Industry Ranking in Revenues”. 2010. Yahoo Finance.
“Newmont – Analyst Opinion”. 2010. Yahoo Finance. Web.
“Newmont Competitors”. 2010. Yahoo Finance. Web.
“Stock Price Graph” 2010. MSN. Web.
