Task 1 Cost and Revenue Assumptions
In order to present any new business proposal for getting necessary financial support in the form of bank borrowings or private equity investments, it becomes important that the business plan be presented along with estimated financial results of the proposed business. It is necessary for the person preparing the forecast financial documents to assume the likely income of the business and the expenses that the business has to incur for earning the revenue. The assumptions relate to the proposed investments in machinery and other running expenses for the first one or more years of working of the company. These are the estimated costs.
On the other hand, the business plan needs to assume the expected sales of the proposed new product for the first year or the period for which the estimated financial statements are prepared. The assumptions will relate to the price of the product at which it can be sold and the likely quantities that can be sold. These are called revenue assumptions. While making the costing assumptions it is necessary that the costs be divided into fixed costs and variable costs. Fixed costs, which are also known as period costs remain fixed up to a certain level of production and sales. Variable costs on the other hand, are dependent upon the number of units the organization may produce during any given period.
The business proposal must present estimated cash flow showing the likely amount of cash that the business can generate during the first year of production/sales and an estimated income statement, which shows the expected income from the business for the same period. The financial documents consist of a balance sheet, which indicates the estimated financial position of the company as at the end of the first operating period.
Task 2 Marginal Costing Cost Statement
Based on the nature of product manufactured and the processes involved, several systems of accounting and analyzing production costs are followed. One of such systems is the marginal costing system (Offenbacker, 2004). Under the marginal costing system, the term cost denotes the total of variable costs, which will increase when the company wants to produce one more of its product. There is a specific term “contribution” used in marginal costing, which is arrived by deducting the total variable costs from the sales revenue. This is the margin from the sales realization, which goes to meet the fixed expenses component of the total cost of production. Any surplus of the contribution margin left after deducting the fixed expenses can be treated as profits of the business (Tutor2u).
Variable expenses also known as direct expenses comprise of raw material used in the manufacture, labor cost involved for production and any other direct expenses incurred for production (Kinney & Raiborn, 2008). Cost classification under marginal costing system is attempted based on the behavior of expenses incurred, rather than on their functions. This is a special feature of the marginal costing system, which enables management to take various business decisions based on marginal cost.
For example, the management may observe difference in the profits earned by sale of different product lines. In such cases to decide on the continuance of a specific product line, marginal costing system helps the management greatly. It may decide to follow the product line, which provides the maximum contribution towards fixed expenses and discontinue those lines, which provide lesser contribution margin.
Use of marginal costing system makes some assumptions.
Marginal costing assumes that it is possible to segregate all elements of cost of production into fixed and variable portions. In practice, this may be difficult. Another assumption is that variable cost per unit of production remains constant irrespective of the level of production, while this may not be the case in reality. Under marginal costing, it is assumed that the variable costs change in accordance with increase or decrease of number of units produced/sold.
However, in practice, this assumption may not hold true. Other assumptions such as selling price per unit will be the same for different levels of sales and fixed cost will remain constant at different levels of production are difficult to hold in practical circumstances. It is also not valid to hold that volume of production influences the cost of production (Horngren et al., 2002).
Under marginal costing system, price of a product is determined based on the marginal costs by adding contribution margin to the total variable costs. The relationship between costs of production, volume of production and profit forms an essential part of the system of marginal costing. Profit represents the difference between marginal cost and the sales realization and after deducting the fixed expenses.
‘SILK’ Hair Protection Gel. Marginal Costing Cost Statement.
According to Michael Porter (1985), an eminent management scholar, the competitive strength of an organization increases, when it is able to control the marginal cost of its product. In the case of “SILK” hair protection gel, the product provides a contribution margin of £ 6.10 per unit of production. When the company is able to produce and sell 180, 000 units during its first year of operation, the venture will result in a total contribution margin of £ 1,098,000. When the total fixed cost of £ 666,000 is deducted from the contribution, the business will earn net profits of £ 432,000. With this profit, the net margin is 14.6% on total sales revenue for the first year.
Task 3 Break Even Analysis
Breakeven analysis is a management tool used for analyzing the relationship between fixed and variable costs and the sales realization. The breakeven sales volume denotes a point of sale or production, where a firm will not be able to meet just its fixed costs, resulting in no economic gain or loss from the business (Collis and Hussey, 2007). This managerial technique works based on the distinction between fixed and variable costs, as the contribution margin is the main element on which the breakeven point is dependent. Knowledge on cost behavior is important for the success of an organization (Anderson et al 2000; Zahra & George, 2002; Cambridge Business Publishers, 2004).
As we saw earlier contribution margin represents the difference between sales realization and total variable cost for producing a product. Variable costs are variable in nature and they change according to the volume of units produced or sold. Fixed costs on the other hand, are those costs, which remain constant until a specific level of production/sales is reached in the business. The major assumption behind working the breakeven point is that the sales and variable costs will remain constant over a particular volume of sales/production.
It also assumes the changes in the variable costs will be directly proportional to the number of units produced/sold and there may not occur any changes in the fixed costs. However, since the variable costs of production in the long run would vary based on the impact of several elements these assumptions are doubtful to be held true. Similarly, the fixed costs cannot always be expected to stay constant for any volume of production/sales.
According to Drury (2006), breakeven analysis as a managerial tool enables managers to take efficient business decisions concerning the level of production/sales, to be reached by a firm to achieve a targeted profit. There are other uses of breakeven analysis identified such as planning and controlling of expense and pricing of product or on the continuance of a specific product line. When a firm is confronted with a decision as to whether buy or lease any equipment, breakeven analysis provides the basis for making a correct decision by the managers.
Using breakeven point analysis firms will be able to fix their sales targets. When the firm reaches the breakeven point sales, it can be inferred that the firm has reached the point of sales, where the contribution is just enough to cover the fixed costs of the firm (Harvard Business School, 2007). Sale of any unit beyond this point will increase the profit of the firm. However, the utility of breakeven point analysis is limited to the extent that it does not consider sale of products in different price points. Moreover, cost is the only main consideration under the analysis, which may have some practical issues. Breakeven analysis suffers from other demerits also.
For instance, one of the assumptions of the analysis is that in a multiproduct environment the proportion of different products will remain constant, whereas it does not happen so in reality. Another assumption, which is subject to criticism, is that under the analysis, the production and sales quantities are assumed to be at the same level. It is also assumed that the variable costs will remain the same for each unit of production in different levels of output.
The contribution margin per unit of production or sales is calculated as below:
“Contribution Margin per Unit = Revenues per Unit – Variable Expenses per Unit” (Accounting Coach, 2004).
Breakeven point can be arrived when fixed costs are divided by contribution margin per unit. The breakeven point is calculated based on the figures calculated under Task 2.
Fixed Costs
= £ 666,000
Contribution per unit = £ 6.10
Breakeven Point = Fixed Expenses/Contribution per unit = £ 666,000/£ 6.10 = 109,180.32 = 109,180 units
The breakeven point indicates that when the new business is able to sell 109,180 units of Silk Hair protection gel, the business will have enough contribution margin to cover the fixed expenses and there will be no economic gains or loss resulting from the business. To calculate the breakeven volume, we have to multiply the breakeven point sales by the selling price per unit. From this figure, it is possible to arrive at the percentage of capacity.
Breakeven point in sales value = BEP in Units x Sales price
= 100,180 x £ 16.40 = £ 1,790,552.00
Breakeven point as a percentage of capacity = BEP in Units x 100/Capacity in Units
= 109,180 x 100 /180,000 = 60.66%
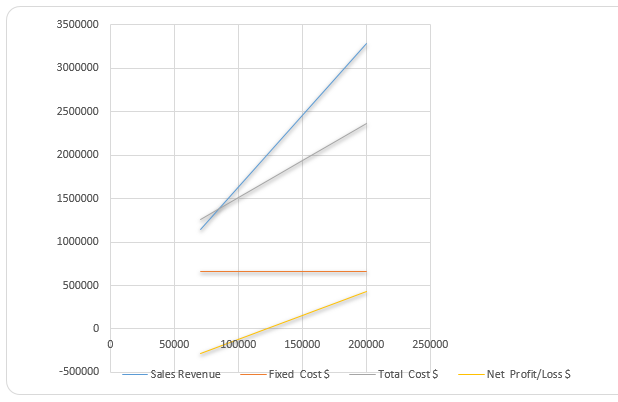
Break Even Table.
The above information can be presented graphically as below.
Task 4 Financial Documents
The financial documents contain the expected income and the financial position of the proposed company.. The financial documents consist of an estimated income statement and cash flow for a specific future period of business. The financial documents also contain a balance sheet showing the financial status of the business as at the end of the period for which the financial documents are drawn. The period for which the forecast is done is either one year or three years.
The financial document of income statement contains the estimated profits of the business during the first year. As stated earlier, suitable revenue and cost assumptions are made to draw up the estimated income statement. Based on the estimated income statement, an estimated cash flow statement is prepared for the projected period, which shows the cash likely to be generated by the business operations during the period. The forecast balance sheet shows the assets and liabilities of the business as at the end of the financial period for which the income statement is prepared.
The financial documents of the proposed business venture of SILK HAIR PROTECTION GEL are presented as a part of this research. It is assumed that the business operations will start during July 2011 and the financial documents have been prepared for a period of one year commencing on that date and ending June 30 2012.
The promoters will introduce £ 300,000 as their own investment in the business. There is the requirement of loan funds to the extent of £ 600,000, for financing the working capital requirements and for investing in fixed assets of the proposed business. The additional funds required have to be taken in the form of loans from the financial market. The interest rate on borrowed funds is assumed at 10% on the loan with payment of interest falling due at the end of every quarter. Repayment of the loan is scheduled over 3 year’s time with £ 200,000 payable from the end of the first year onwards. The business will offer products to the dealer and other distribution channel on both cash and credit terms, with the credit period extending up to 15 days. The business is expected to get supplies of materials on credit for 15 days.
From the own funds invested and the borrowed funds, the business will invest £ 500,000 in equipments, plant and machinery and furniture. These assets will be depreciated at varying rates for the year of business and the depreciation will be charged off against the estimate profits. For the business premises a monthly rent of £ 10,000 and a rental advance of £ 120,000 is payable.
The estimated cash flow statement, prepared for the first year of operations indicates that the business will be able to generate operating cash of £ 170,000. This cash balance is after making the repayment of the first installment of the loan of £ 200,000. With the cash flow at this level, the company will be having enough cash surplus to meet its short-term financial commitments. The business therefore can be said to have sound financial position as at the end of first year.
The operating profit of the business before interest and depreciation is estimated to be £ 601,000 and the operating profit margin on sales works out 20.36%, as per the forecast income statement. After charging interest and depreciation of £ 90,000, the business will earn a profit of £ 511,000 at the end of the first year of business. This shows the profitability of the business at 17.31% of the total turnover. It is assumed that the company may have to pay income tax at the rate of 30% on its net profits. Net profit after taxation is calculated at £ 357.700, which is 12.12% of the total sales. No stock of materials or other items has been assumed for calculating the estimated income.
With the case generation from the operations because of higher profitability, the business will be having a sound financial position as at the end of the first business year. The proposed capitalization of the company with loan funds of £ 600,000 forms a good basis for furthering the business of the company, with debt-equity of 57.1%. The current assets are sufficient to meet the current liabilities with a current ratio of 1.48.
Task 5 Pitch
Business Proposal for New Silk Hair Protection Gel
Introduction
The market for hair care products is highly competitive. Therefore, the product must meet quality and price expectations of the consumers to achieve sizeable market share. Changes in customer choices in hair care products offer good potential for new products to enter the market. However, it is also equally important that the product be priced properly so that it can compete with already established products in the market. The introduction of “Silk” hair protection gel for women has considered both price and quality aspects and it will be a sure winner in the hair care product market in the shortest time possible.
The target segment for the proposed product is the younger women, in the age groups of 18 to 35, inclusive of both college students and office goers with the ability of the product to protect their hair styling and at the same time adding to the shine of the hair. The gel possesses the quality of protecting the hair from heat and dust. This note is intended to present a business investment proposal to the potential investors for financing the venture. A set of financial documents is attached to this note, to explain the profitability and financial soundness of the venture.
Background
The new “Silk” hair care protection gel will meet the needs of the women falling in the age group between 18 and 35. The target customer segment consists of younger women who are keen to groom themselves and are looking for new products meeting their quality expectations. Despite the fact that there are number of products available in the hair care both branded and unbranded, the customers will select only those products, which really meet their perceived quality. The proposed “Silk” hair protection gel has been proved to meet the intended use of the product through laboratory tests and through sampling and test marketing.
A professional market survey organization helped in identifying the target market segment. Based on customer market surveys this target market was identified by the consultant organization. According to the market surveys, the proposed product is expected to capture a significant market share within the first three years of introduction. The price and quality of the product have been subjected to careful consideration and fixed to penetrate the market successfully and are in comparison with all other available products, apart from being competitive. With the proposed marketing strategy and marketing communication, the product will achieve success in the first few months of entry.
Marketing Plan
4Ps of marketing is the basis on which the product will be marketed. The 4Ps of marketing covers the entire spectrum of marketing of a product by extending the considerations to the “product, price, place and promotion” aspects of the product (Longenecker, et al, 2009). According to Brassington and Pettitt, (2003), when a firm is able to identify the 4 Ps of a product proposed to be introduced in the market; it will be able to influence the consumer buying significantly. The concept of 4 Ps of marketing was introduced in the mid 1960s by Jerome McCarthy, a famous marketer, 1964. Subsequently, there have been numerous research conducted to develop the concept further to make it fitting to the current marketing environment (Kent, 1986; Low and Tan, 1995; Palmer, 2004; Moller, 2006).
Understanding the importance of presenting a product attractively to make it appealing, packing of the new product has adopted an innovative design to attract more number of customers. Marketing strategy for placing and promoting the product was based on the concept of 4Ps (Londre, 2009). Designing the marketing strategy covers various decisions on the aspects of branding, functionality and styling including packing and presentation (NetMBA, 2010).
“SILK” hair protection gel will be packed in attractively designed containers and outer packs, which will add superiority to the product as compared to other products in the market. The volume of containers will be decided based on the optimum consumption for four to eight weeks; it has been proved with the tests on consumption of the product, that it would meet the desired levels of satisfactory consumption.
The product is priced in comparison with other branded products in the market, so that it will be able to penetrate into the market. The price of the proposed product will rank third as compared to other two competitors. There will be an inaugural price reduction offer for introducing the product in the market. Expenses like marketing expenses and commission to agencies have been considered for the initial pricing of the product.
Being a cosmetic product, the new product will be made available at all retail points of sale including chain stores, supermarkets, convenience stores and pharmacies. The distribution network will consist of dealers, distributors and agencies. Attractive margins for the distribution chain partners have been worked out in the form of commission on turnover, so that they would be interested in distributing the proposed product in large volumes.
The most important part of the marketing strategy is to adopt effective marketing communications. The customers should be made aware of the superiority of the products and the value they get for their money, by appropriate marketing communications. Direct marketing strategy will be engaged for promoting the sale of new product. The customers will be contacted directly through their email ids to explain the quality and comparative placement of the product in terms of the price. The marketing communication will elaborate on the superiority of the product by highlighting the salience of the quality and use of the product. Commercial media like the print and television media will be used for promoting the product. Appropriate marketing communication is an important element in the success of marketing (Kotler, 2009).
Financial Excellence
A review of the estimated financial performance of the business as shown by the financial documents annexed to this note will indicate the expected profits and return from the business from the first year of introduction onwards. With the own capital of £ 300,000 that will be introduced, the promoters are looking for financial assistance of £ 600,000 for meeting the fixed and working capital needs of the venture.
The promoters are willing to consider payment of interest at the rate of 10% per annum, with the possibility of converting the loan in to equity, if the investor would like to capitalize his investments. From the financial documents attached, it can be observed that the business has a payback period of less than three years. The business is expected to provide a rate of return of 39.74% on total investments. The net profit margin on sales is 12.12%, which is higher than any firm operating in the industry is.
Conclusion
The new product will acquire its competitive strength because of its quality and price positioning. With the improved product quality and placement, Silk hair protection gel will win over the competitors. The product meets the standards for human use and the laboratory tests have proved that the product will deliver the intended benefits. This will increase the scope for marketing of the product, with more customers starting to use the product. The use of direct marketing strategy and communication for the proposed product together with the inaugural price reduction offer, the product will penetrate the market soon and capture significant market share within a reasonable period. The findings of the market surveys indicate a grand success of this product.
The financial position and profits as indicated by the financial documents of the company indicates sound financial position of the business with the potential for higher returns on investments and substantial cash flow prospects. Therefore, the investment in the proposed business venture can be considered feasible and profitable.
Appendix
References
Accounting Coach, (2004), Break-even Point. Web.
Anderson, R.I., Fok, R., and Scott, J. (2000), Hotel industry efficiency: an advanced linear programming examination, American Business Review 18(I), 40-48.
Brassington F, Pettitt S (2003). Principles of Marketing, Third Edition, Prentice Hall/Financial Times. New Jersey.
Cambridge Business Publishers, (2004). Cases in Managerial and Cost Accounting. Web.
Collis, J. and Hussey, R. (2007) Business Accounting: An Introduction to Financial and Management Accounting, Basingstoke: Palgrave Macmillan.
Drury, C., 2006. Cost and Management Accounting — An Introduction. USA: Cengage Learning.
Harvard Business School, (2007). Break-even Analysis Tool. Web.
Horngren T. Charles, Foster George & Datar M Srikant (2002) Cost Accounting: A Managerial Emphasis Edition X Prentice Hall India Private Limited India.
Kent, R. A. 1986. Faith in the four Ps: An alternative. Journal of Marketing Management, 2, 145-154.
Kinney, M.R. & Raiborn, C.A., 2008. Cost Accounting: Foundations and Evolutions. New York: Cengage Learning.
Kotler Philip, (2009), Marketing Management, 13th Ed., Prentice Hall, NY.
Londre Larry Steven, (2009). Marketing, the Marketing Mix (4P’s) and the Nine P’s. Web.
Longenecker, G. Justin., Petty J William., Palich E Leslie., and Moore W Carlos (2009). Small Business Management: Launching and Growing Entrepreneurial Ventures.USA: Cengage Learning
Low, S.P. and Tan M.C.S. (1995), A Convergence of Western Marketing Mix Concepts and Oriental Strategic Thinking: Examines How Sun Tzus The Art of War Can Be Applied to Western Marketing Concepts, Marketing Intelligence & Planning, Vol. 13, No. 2, pp. 36-46.
McCarthy, E. J. 1964. Basic Marketing, IL: Richard D. Irwin.
Möller, K. 2006. The Marketing Mix Revisited towards the 21st Century Marketing by E. Constantinides. Journal of Marketing Management, 22(3), 439-450.
NetMBA, (2010). The Marketing Mix (The 4 P’s of Marketing). Web.
Offenbacker Stephen, (2004). Marginal Costing as a Management Accounting Tool. Web.
Palmer, A. 2004. Introduction to Marketing – Theory and Practice, UK: Oxford University Press.
Porter, M. E. (1985). Competitive Advantage. Free Press , 33-61.
Tutor2u, n.d. Marginal Costing. Web.
Zahra, S. A., & George, G. (2002). International Entrepreneurship: The current status of the Field and Future Research Agenda in Strategic Entrepreneurship creating a new mindset. Oxford Uk: Blackwell Publishing.