Introduction
Purpose of Study
Samba Financial Group (Samba) is the leading institution in Saudi Arabia providing financial services and products through its net work of branches in Saudi Arabia, Pakistan, Dubai, and UK. The purpose of current study is to evaluate the financial performance of Samba over a period three previous years, keeping in view that the main objective of the bank is to invest in staff, reinforce its social responsibility, and to maximize the wealth of shareholders.
Methodology and source of data
For this evaluation the financial statements available at the company site as well as the information and data available at Saudi stock exchange is used. The company is listed with Saudi Stock Exchange (Tadawul).
Production and Cost Analysis
Nature of Products and Underlying Technology
Financial and other products in which the bank deals in are priority banking (that is gold and diamond, phone banking), ATMs, debit cards, credit cards, Islamic credit cards, co-branded credit card, AlKhair credit cards for Islamic, foreign exchange and interest rate derivatives and others.
Breakeven Analysis
Breakeven analysis is also called cost- volume- profit analysis. There are no profits and losses at break even point. This is because the margin created at breakeven point is exactly same as the total costs. For computing break even point, it is necessary to differentiate between variable costs and the fixed costs of the products. Fixed costs are functioning of time and not of sales volume like rent, interest etc. These are typically contractual. Variable costs are directly related to the sales and vary as per increase or decrease in sales. At breakeven point EBIT (earning before interest and taxes) are equal to total costs and can be calculated using following formula:
EBIT = (P 8 Q) – FC – (VC 8 Q), where
P= sales price per unit, Q= sales quantity in units, FC = fixed operating cost per period, and VC = variable operating cost per unit. As it is not possible to differentiate between variable and fixed cost in the case of Samba Financial Group, its break even revenue is considered at the point where total costs of earning that revenue are equal to the revenue itself. The calculations are made as under:

Degree of Operating Leverage
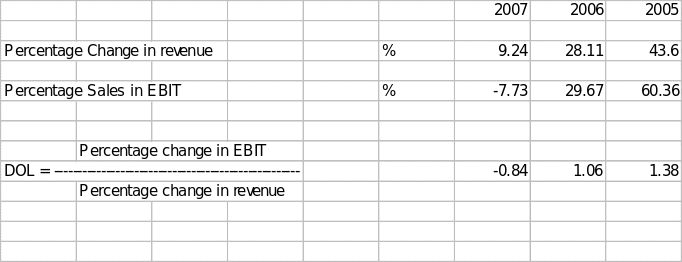
Operating leverage is the result of effect of the fixed operating costs. Change in gross revenue brings in changes in EBIT either equal to changes in gross revenue or more or less than changes in gross revenue. The measurement of such changes is called degree of operating leverage (DOL). The degree of operating leverage exists only when the percentage of change in EBIT is greater than the percentage of change in sales. In other words when DOL is more than one, there is operating leverage; otherwise there is no operating leverage. DOL in case of Samba Financial Group is calculated as under:

The above figures reflect that there is no operating leverage in 2007 when DOL is less than one. However operation leverage exists to the degree of leverage in 2006 and 2005 as in each of these years the DOL is positive or more than one.
Financial Ratios and Trend Analysis
Liquidity
Liquidity of a company is analyzed to judge its ability to meet short term obligations. While analyzing the liquidity of a company the approach is to compare short term obligations with short term resources available to meet short term obligations.
The most general and frequently used measure to test the liquidity of a company is its current ratio. But in case of a bank the liquidity cannot be measured with current ratio as its liquidity depend upon the reserves required to be kept by the bank in relation to total deposit and such ratio is called Cash Reserve Ratio (CRR). As per Bank control law and the directions of Central each bank is required to maintain certain amount of statutory deposit with central bank or other banks. Accordingly the liquidity of Samba Financial Group cannot be greatly commented upon as the required deposits have been kept the company with central and other banks as stated in the notes to its financial statements.
Activity
In case of a banking company its activity has to be judged in a different way than other commercial institutions. The ratio that is used to judge the efficiency in a bank’s activities is the loan to deposit ratio. ‘The loan to deposit ratio is by far the most reliable measure of a bank’s lending activity. It is the dollar amount of its loans calculated as a percentage to the total dollars on deposit. A loan to deposit ratio of 70 percent is regarded by many banks as optimal.’ (Theodore A Platz and other, page 22)1 Loan to deposit ratio of more than shows that bank is willingly efficient to promote its activities. However anything less than 40% is an indication of bank’s inefficiency. Loan to deposit ratio in case of Samba Financial Group is calculated as under:

The efficiency in the activity of Samba has been declining over the years. Loan to deposit ratio in 2005 was brilliant 73.19% and that came down to 70.66% in 2006 and further down to 69.56% in 2007. It is certainly very encouraging as the total loans out of deposits are bordering 70% in all the three years but tend is downward. The company has to arrest this downward trend.
Leverage
Leverage is the effect of use of fixed cost assets to increase shareholders wealth. There are three types of leverages operational, financial, and total leverage. Operational leverage is relationship between sales and EBIT. Financial or capital leverage is the relationship between debt capital employed and equity capital employed in financing the assets of the firm. Total leverage is the relation between entity’s sales and its earning per share. In case of banking company like Samba Financial Group the financial or capital leverage has an important and effective role to play. It is also called capital gearing and is calculated based on debt ratio of the company.

The company appears to be highly geared but that is not a limitation for a banking company. The nature of business indicates that debts play an important role in financing the loans and advances those are assets of the company. Accordingly a banking company line Samba Financial Group will always appear to be highly geared company so far as financial or capital leverage is concerned.
Profitability
The profitability of a banking company can best be evaluated by using Return on average assets and return on equity ratios. For Samba Financial group these ratios are calculated hereunder:

Profitability wise the company’s performances are dwindling over the years. Return on average has come down from 4.21% in 2005 to 3.11 % in 2007. Also return on equity has come down from 31.13% in 2005 to 26.75% in 2007. It appears that operating expenses are rising in greater ratio than the operating income and net income is therefore dwindling year after year. The company has to analyze its operational expenses and also find out more resources of revenue in order increase its profitability.
Growth
Growth of a banking company can be assessed from its rising loan and advances as compared to its increasing deposits. In other words loan to deposit ratio is again the best indicator of growth of the company. From this point of view the company’s growth is not providing an encouraging picture. The loan to advances ratio has gone down from 73.19% in 2005 to 69.56% in 2007. This dwindling growth of the company is again corroborated from the fact that earning per share has also gone down from mighty SAR 33.49 per share in 2005 to mere SAR 8.05 per share in 2007. The company is certainly not growing in real terms though overall total assets of the company might have been increased tremendously in 2007 when compared with total assets in 2005.
Capital Investment and Financing
Analysis of Capital Expenditure
The company’s major capital expenditure that has taken place in 2007 is in international securities. To total increase in such investment at fair value in the year 2007 is SAR (in ‘000) is 30564 only. Capital expenditure in securities available for sale in the balance sheet has increased from SAR (‘000) 10466640 in 2005 to SAR (in’000) 25232431 in 2007.
Average rate of return on investment
Average rate of return is calculated hereunder:

The average rate of return on investment is an investment appraisal criterion. As discussed above the return on company’s total investment is going down over the year. The reason appears to be fluctuating income from investments help for trading shown in the income statement. As the evaluation of such income is being done on fare value basis, the fair value method applied by the company takes its toll and the result is lowering average rate of return. This is one of great limitation of fair valuation method adopted by the IFRSs.
Dividend Policy
The company is following a cash dividend policy. Total amount of dividend paid by the company over the years is as under:
Year 2005 2006 2007
Dividend in SAR (in ‘000) 2150427 2803525 875510
The above are figures of dividend paid during that year. Dividend declared per share is as under:
Year 2005 2006 2007
Dividend (per share) declared in SAR 1.70 17.40 10.50
Dividend declared per share is describing the dwindling profitability of the company. The dividend per share in 2007 has gone down to only SAR 1.70 as compared to mighty SAR 17.40 in 2006.
Source and Uses of Funds
The company is using both long term as well short term sources for financing its assets. During the year 2005 to 2007 total assets of the company were financed as under:
Amt.: SAR in ‘000
Year 2007 2006 2005
Total assets 154413974 124014813 108306346
Equity Capital 17975563 15299618 12906166
Borrowed Capital 136438411 108715195 95400180
Estimate of the Cost of Capital
The company needs to earn at least the cost of capital. Cost of capital is an important rate of return expected by the existing capital providers. As the company is using both debt capital and equity capital, the cost of capital may be calculated as under:
Cost of debt = Interest agreed to be paid on loans
Cost of equity = required rate of return which should be risk free rate plus risk premium.
It is difficult to estimate cost of capital employed by Samba Financial Group in view of the fact that financial statements available at the site of company do not carry the required information to calculate such cost of capital.
Evaluation of Stock Price Performance in the Market
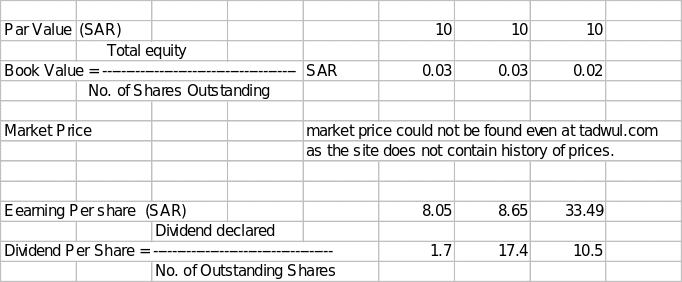
The required values are calculated hereunder:

Book value has rose slightly in 2006 as compared to 2005 and thereafter it remained constant in 2007.
P/E ratio cannot be calculated in absence of availability of history of market price even at tadawul.com.
Summary and Conclusion
The company is facing problems being faced by all banks and financial institutions. Despite the company has made huge investment in available for sale securities and has taken risks. It appears that risks taken by the company will pay off its results and earnings of the company will improve. At present the company is not performing well profitability
Wise, but is hoped with improvement in banking sector and by introduction of new financial products, the company will show good results. For the time being the company should not disturb its existing investment portfolios.
References
Theodore A Platz and other, Business Banking, Barron’s Educational Series, 2001, page 22.

