Introduction
Many people who are interested in investments in stock markets seek appropriate solutions to problems associated with stock prices. These solutions are incredible in enabling potential investors to evaluate whether it is possible to make profits from the differences that exist in the prices of stocks of companies listed on stock exchanges over a given period. Several analytical tools are deployed to enable investors to make this noble decision by fostering substantive acquaintance with the current stock markets situations, particularly the prediction of the trends of stock prices. Many of these analytical tools fall under two main groups: indexes and exchange averages.
The tools are used as a means of indication of the value of a company’s stocks. Value is an indication of the probability of investors to make profits in the future when they commit their monetary resources to the purchasing of a company’s stocks. Company directors often believe that stock markets fail ‘correctly’ to value the firms they manage while investors are often alarmed by the volatility in share prices. This suggests that stock markets may not always be reliable indicators of a company’s value. Indeed, stock market indicators that are normally used to indicate the value of investments on the stock markets are based on past stock markets changes, as opposed to future anticipated changes. Based on this argument, and by considering Easy Jet Company as the case study, this paper argues that stock markets may not always be reliable indicators of a company’s value.
Company Background
Easy Jet was listed on the London stock exchange on 22nd Nov. 2000. As Easyjet plc (2000) reckons, “the initial public offering is a significant milestone for Easy Jet that will allow maximization of growth potential by helping fund planned new Boeing 737-700 purchases” (Para. 2). It was also considered as an incredible step towards maximization of the company value. Easy Jet Airline Company limited is listed in the London stock exchange under the tag name LSE: EZJ. The company has its headquarters based in London Luton Airport. Based on the number of passengers that are flown, the company is the biggest airline in the United Kingdom.
It provides air travel services to about 600 routes, which are located in about 300 countries both domestically and internationally. In the London stock exchange, the company is a constituent of the FTSE 250 Index. The company started undergoing rapid expansion in 1995. By September 2012, the company had an employment capacity of 8,446 people coming from diverse backgrounds.
This huge success of the company may create perceptions that its performance in the stock exchange may be a subtle ground for making decisions on investments in its stocks by virtue of the argument that the performance may be an indicator of the value of the company. However, this may not be the case since Easyjet plc (2009) cautions people perusing its website, “past performance cannot be relied upon as a guide to future performance, and share prices can go down as well up” (Para.2). Therefore, stock markets prices as a measure of the value of a company are not substantive for making investment decisions in stock markets.
The success of Easy Jet in Delivering Value to Shareholders over the Past 5 Years
of Financial performance of an organization may be evaluated in a variety of ways. Profitability is one of the ways. For the case of Easy Jet, and as evidenced by Appendix 1, the company has not been recording constant profits both before and after taxations in the last five years. For instance, in 2007, the company recorded pre-tax profits of 201.8 million pounds. In the following two years, the pre-taxed profits were on downward trends before they started to rise in 2010 through 2012. After taxing, profits also followed a similar trend within the last six years, 2012 inclusive. Profit level in a company that is publicly traded has a link with the stock market’s performance (Simkovic 2009, p.58) because organizations whose profit margins are high also tend to have high stock prices.
During the period of increase in the profitability of a company, for instance between 2010 to 2012, for the case of Easy Jet, as shown in appendix 1, when such increases are backed up by increases in stock prices, investors earn hefty returns from the sale of stocks. This happens in case stocks are bought at lower prices when a company is encountering reduced financial performance, for instance in 2008 and 2009 for Easy Jet as shown in appendix 1. However, upon utilizing such trends to make investment decisions, the performance of a company based on the stock markets becomes an unreliable source of value because the direction taken by the trend cannot be predicted in the future from the present figures.
Rather, the financial performance of a company based on the performance of the stock of a particular company becomes clear when analyzed from the existing past data. This means that, even though the value of stock markets of a company as shown by its performance in the stock markets in the past may seem bright, a change of market dynamics may offset the past performance characterized by high levels of profit margins into a performance characterized by losses. However, based on the financial performance of Easy Jet in the last three years, it can generally be argued that, when the shareholders’ value is measured from the dimension of profitability, the company has been able to ensure that the value of the capital committed to the company by shareholders gains value.
How and Why the Market Value of Equity for Easy Jet has Changed over the Past 12 Months
Easy Jet has experienced an incredible increase in profitability within the last twelve months, which has resulted in a change in the value of its market equity. A number of factors have contributed to the changes. Firstly, the company embarked on a mechanism of careful allocation of revenues. It put in place strategies of tight controlling of costs coupled with ways of ensuring that the company experienced low rates of disruption in comparison to 2011. For this reason, according to Easyjet plc (2012), the company has been able to “reduce its first-half pre-tax loss by £41 million to £112 million despite an £87 million increase in its unit fuel costs” (p.3).
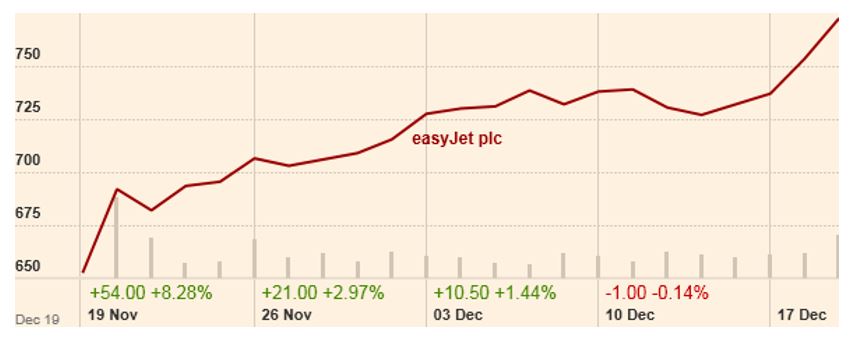
The impact of this strategy on the stock prices, and hence the equity values of the company for the last two months, is made clear upon scrutiny of the results shown in appendix 2, which indicate that the general trend of the equity values was an upward trend.
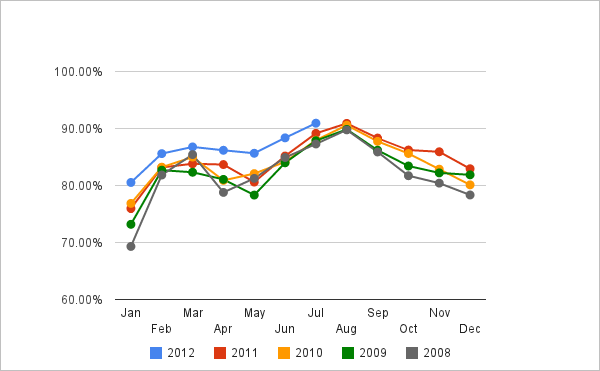
Secondly, due to the increase in market capacity, Easy Jet experienced a growth of 11.9 percent in terms of revenues earned per seat and a growth of 11.2 percent at a constant currency. Easyjet plc (2012) associates this growth with “improvements in revenue management, website initiatives, and Europe by Easy Jet marketing campaign “(p.3). The load factor has also substantively increased with the last 12 months from 87.3% to 88.7 % as shown in appendix 1. This means an increase in the revenues earned by the company and hence its profitability levels. This factor has contributed to an increase in the market equity values for Easy Jet in the sense that it has made investors consider committing their resources to the company in anticipation of high gains in the future.
Valuation of the Equity of Easy Jet
In 2012, Easy Jet has reported an increase in its returns on equity from 14.0 percent in 2011 to 14.6 percent in 2012. This finding is a change of +0.6ppt. Arguably, the valuation of equity of any company trading publicly can be done in various ways. In this section, Net Asset Value, Price per Earnings Ratio and Discounted Cash Flow are applied to evaluate the equities of Easy Jet.
Net Asset Value
While gauging the performance of company equities in the financial markets, net asset value is essential in revealing both the long-term and short-term performance of a company’s stock. For the case of companies, which have their share trading freely in the stock markets such as Easy Jet, the measure of the net asset value used is the net asset measure per share. According to Brealey and Myers (1991), the measure helps “…investors to understand the factors affecting mutual fund’s results at the end of each month and quarter” (p.67). Over the last five years, Easy Jet Company has reported varying amounts of net asset worth per share as shown in the table below.
Table showing the variation of net asset value per share for Easy Jet
Source: (Easy Jet (EZJ) 2012)
The above net asset value per share for Easy Jet is inclusive of intangibles. From the figures of net asset value per share of the company as shown in the table above, it is clear that Easy Jet has been experiencing a constant increase in the net asset value per share. Therefore, it is arguable that this trend may give an indication of the likelihood of the company to do well in the stock markets. However, net asset per share values are not adequate in helping to indicate the value of stock markets in the future because net asset value per share does not reflect future gains equally with stock markets’ share prices. Indeed, with regard to Teweles and Bradley (2008), “NAV and traditional security prices such as stock prices available on security exchange provide investors with information on market developments and sector economic growth” (p.23). Fund managers give net asset values for a company once the financial market operations have closed.
Price per Earning Ratio
Price per earning ratio, which is alternatively called earnings multiple or price multiple, is the market value per share of a company in comparison to earning per share (EPS). Normally, the values that are used in the calculations of the price-earnings ratio are for the last four quarters. For the last twelve months, the earning per share of Easy Jet Company was 62.50. The share price was 754.00. Dividing share prices with earnings per share gives a quotient of 9.29 as the price per earnings ratio for the last 12 months. This calculation is based on past data and the anticipated data. According to Copeland, Tim, and Murrin, “a high price per earnings ratio suggests that investors are expecting higher earnings growth in the future compared to companies with a lower price per earnings ratio” (2000, p.82). Nonetheless, a high price per earnings ratio is not indicative of the entire story of a company. Investment decisions are based on the comparative analysis of various companies with the company where potential investors have likelihoods of earning optimal returns being the most preferred for committing resources.
In the computations of the price per earnings ratio, challenges in the reliability of the ratio as a true reflection of the company’s stock market value are encountered. This argument holds since “the denominator (earnings) is based on an accounting measure of earnings that are susceptible to forms of manipulation, making the quality of the P/E only good as the quality of the underlying earnings number” (Copeland, Tim & Murrin 2000, p.56). This has the implication of giving the perception that price earning per ratio does not act as a precise measure of the value of the stock market of companies including Easy Jet. Additionally, the chief roles of computing indicators of stock prices are not based on the need to provide a mechanism of providing information on how the market value of shares of an organization would vary in the future. Rather, the whole idea circulates around the need to give insights on how the organization under scrutiny is performing, say over the last quarter year, month, or week.
To this end, Easyjet plc (2010) informs, “basic earnings per share have been calculated by dividing the profit for the year by the weighted average number of shares issued during the year after adjusting for shares held in employees’ share trusts” (p.71). In case of earnings per share dilution, “the weighted average number of ordinary shares issued is adjusted to assume conversion of all dilutive potential shares” (EasyJet plc 2010, p.71).
Discounted Cash Flow
With regard to Chander (2012), “the concept of Discounted cash flows (DCF) valuation is based on the principle that the value of a business or asset is inherently based on its ability to generate cash flows for providers of capital” (p.342). To this extent, the DCF is largely dependent on the basic anticipations of business, as opposed to historical precedents of public market factors. Hence, it is a theoretical approach, which relies on myriads of assumptions. However, when applied in the context of analysis of the performance of a company that publicly trades its shares, DCF analysis “yields the overall value of a business (enterprise value) including both debt and equity” (Chander 2012, p.342). Arguably, potential investors can rely on the discounted cash flows for Easy Jet to make decisions on whether to invest in the company or not.
At Easy Jet, DCF is composed of three main parameters. The first parameter is the free cash flows, which includes the cash “generated by various company business assets that include the intangible and the tangible assets available for distribution to various providers of capital to the company” (Chander 2012, p.342). This element is not impacted by the structures of business capital. The second element is the “terminal value that entails free cash flow (FCF) horizon period value projections” (Chander 2012, p.342). Lastly, DCF has the component of the discount rate. In all organizations including the Easy Jet, this element encompasses “the rate used to discount projected FCFs and terminal values to their present values” (Chander 2012, p.342). Therefore, the DCF valuation for Easy jet is as shown in the table below:
Source: (Easy Jet EZJ 2012)
Cash flow discounting is done by projection FCF over a horizon period followed by calculation of terminal value at the end of the horizon period. Once this is done, “discounting the projected FCFs and terminal values using the discount rate to arrive at the NPV of the total expected cash flows of the business or assets are done (Chander 2012, p.344). To this end, it is crucial to note that, at Easy Jet, analyzing the share market value by using the approach of discounted cash flows is incredible since it has the component of future anticipated financial gains. Even though the prediction of future performance on the share market of Easy Jet using the cash flows discounting is not precise, the prediction over the last five years has been realized since the company has recorded increased profitability.
Reconciliation of Share Market Value
Given that there exists a probability that the current market dynamics that face Easy Jet will remain stable in the first quarter of 2013, it is likely that the net asset value will continue to rise hence maintaining the trend for the last five years. However, it is crucial to note that a guide to investing in Easy Jet shares based on this assumption is not advised partly because the computation of share market value on this approach is based on past data rather than future projections. A similar challenge is introduced when the approach of stock price-earnings ratio is used in the evaluation of the likelihood of profitability of investments in share markets of Easy Jet in the future.
This difference may be reconciled by the deployment of the discounted cash flows to evaluate the potential of an investment in Easy Jet’s stock markets to be profitable in the future. However, it is critical to note that, even if discounted cash flow approach may help in making investment decisions, it is necessary to appreciate that any investment is prone to risks. Some market forces are dynamic to the extent that they may not be predicted. For instance, the loss of profitability of Easy Jet in early 2000 after it was listed in the London stock exchange due to escalating fuel costs was largely unpredictable.
Conclusion
The market share value of publicly traded companies may be appraised in a number of ways. This paper discussed the valuation of Easy Jet’s share market performance from the context of discounted cash flow, price per earnings ratio, and net asset value. To this end, it was maintained that these approaches often make use of past data on the share market performance of companies and data on share prices. Since the stock market performance is evaluated based on the three approaches of evaluating the performance of publicly traded companies, it is held that stock markets may not always be reliable indicators of a company’s value.
References
Brealey, R & Myers, S. 1991. Principles of Corporate Finance, McGray-Hill, New York, NY.
Chander, S. 2012. ‘Discounted Cash Flow –The Prominent Income Approach to Valuation’, Journal of Public Corporate Finance, vol.3 no.1, pp. 341-345.
Copeland, T, Tim, K & Murrin, J. 2000. Valuation: Measuring and Managing the Value of Companies, John Willey & Sons Inc., New York, NY.
Easy Jet EZJ 2012. London stock markets. Web.
Easyjet plc 2000. Easy jet shares now listed on the London stock exchange. Web.
Easyjet plc 2009. Share Price Information. Web.
Easyjet plc 2010. Annual Report and Accounts 2010: Notes on Accounts, Easy jet, London.
Easyjet plc 2012. Improved operational and financial results reflecting the continued successful implementation of strategy, Easy jet, London.
Simkovic, M 2009. ‘The Effect of Enhanced Disclosure on Open Market Stock Repurchases’, Berkeley Business Law Journal, vol. 6 no. 1, pp. 56-61.
Teweles, R & Bradley, E 2008, The Stock Market, John Willey & Sons Inc., New York, NY.
Appendices
Financial Performance
Source: (Easy Jet (EZJ) 2012)
Stock prices performance
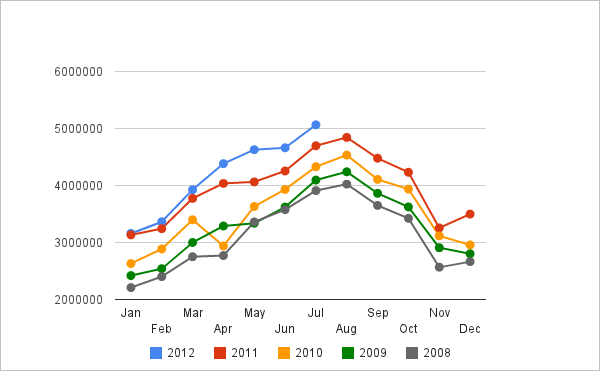
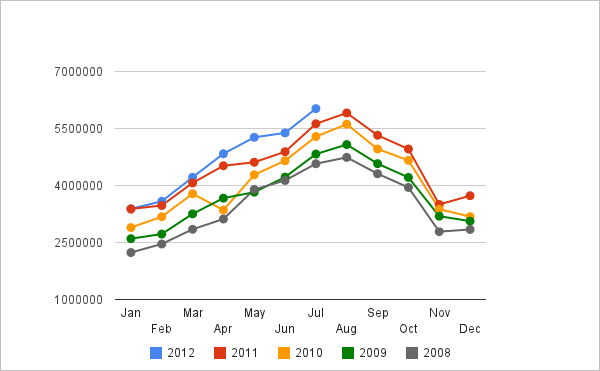
Easy Jet Passengers
Easy Jet Capacity (Available Seat Kilometers, ASKs)
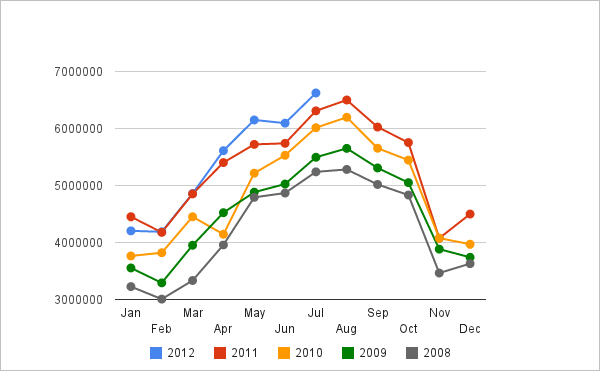
Easy Jet Traffic (Used Seat Kilometers)
Easy Jet Load Factor (%)
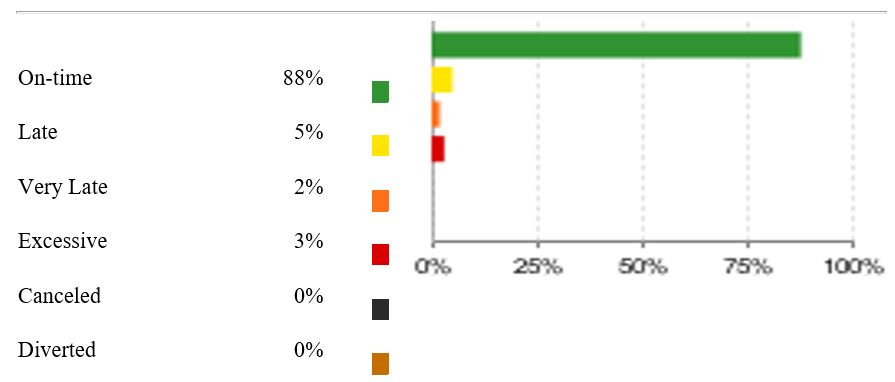
Time Performance Summary