McDonalds is an amalgamation of fast food restaurants with over 25,000 restaurants in 117 countries across the globe. This paper shows a corporate analysis of McDonalds. Distinctively, the paper revolves around the assessment of the company’s financial statements, strategies, financial ratios and new investment decisions. This analysis is to determine whether McDonalds offers a possible investment decision for any potential investor. Looking at the financial statements of McDonalds, a potential investor would depict that the company is managed properly, as it is extremely profitable with a great possibility of growth in future. Examination of the company’s shares discloses that the shares are doing so well in the security market hence promising great returns and growth in the years to come. McDonalds pricing strategy has put it on the competition edge, as its analysis shows that it has segmented and priced its products according to the location. The conclusion of this research is that McDonalds is a practical investment opportunity for any potential investor seeking to attain high return.
Introduction
For McDonalds to achieve its sole aim of profit maximization for its shareholders, the management should be able to work on the production and operating cost. This is achieved by analysing the unit costs of production to determine the correct pricing of that particular product in order to avoid under pricing or overpricing. Locations of its business should also be a factor to capitalize on in order to achieve this goal. Extensive market research or survey should be carried out to come up with accurate or near accurate estimations that would be used in evaluating the investment proposal. Such information should be used to go beyond optimality in order to answer the question ‘what if’. This would enable the the McDonalds to check whether it has a counter strategy in case not all go according to the plan.
Cost Reduction
The process of setting, revising and monitoring standards encourages appraisal of methods, materials and techniques thus leading to cost reductions. Analysis of unfavourable variances directs cost analysis to factors that make costs exceed the budgeted costs. These factors can lead to cost reduction if properly controlled. Cost reduction can be achieved by employing techniques such as the use of budget estimates, forecasts and analyses. In order to succeed in this quest, McDonalds should employ the steps of strategic cost, which include identifying the appropriate value chain and assigning costs and assets to it (Langfield-Smith & Thorne 2009, p. 36). Identifying the cost drivers of every value action, as well as how they interrelate with one another is another step. Furthermore, identifying challenging value chains and establishing the comparative cost of competitors, as well as the causes of cost dissimilarities is another step.
The three main elements of strategic cost management include value chain analysis, strategic positioning and cost driver analysis.
Value Chain Analysis
Every firm is has a collection of activities that are performed to design, produce, market, deliver and support its products/services. This would create a competitive advantage. A firm creates competitive advantages by finding new ways to conduct activities such as improving efficiency through automation and managing the linkages between activities better. This would consist of spending on better product design, which may reduce after sales service costs, as well as the linkages between customers and suppliers. Value activities are physically and technologically distinct activities that a firm performs. A firm creates products and services valuable to its customers by these building blocks. Managers recognize the importance of cost, and many strategic plans establish “cost leadership or “cost reduction as the main goals. However, the behaviour of cost is rarely well-understood (Weygandt, Kimmel & Kieso 2009, p. 13). Managers regularly disagree over a firm’s relative cost position and the reasons underlying it. Cost studies tend to concentrate on manufacturing costs and overlook the impact of other activities such as marketing, servicing, and infrastructure. Moreover, the cost of individual activities is analysed sequentially, without recognizing the linkages among activities that can affect cost.
Finally, firms have great difficulty assessing the cost positions of competitors, an essential step in assessing their own relative positions. They often resort to simplistic comparisons of labour rates and raw material costs. The absence of a systematic framework for cost analysis in most firms underlies these problems. Most cost studies address narrow issues and take a short-term viewpoint. Popular tools like the experience curve are often misused in cost analysis (Schwalbe 2005, p. 18). The experience curve can serve as a starting point, but it ignores many of the important drivers of cost behaviour and obscures important relationships among them. Cost analyses also tend to rely heavily on existing accounting systems. While accounting systems do contain useful data for cost analysis, they often get in the way of strategic cost analysis. Cost systems categorize costs in line items such as direct labour, indirect labour, and burden, which may obscure the underlying activities a firm performs. This leads to aggregation of the costs of activities with very different economics, and to the artificial separation of labour, material, and overhead costs related to the same activity. The value chain provides the basic tool for cost analysis.
Activity Based Costing (ABC)
This is a costing method that cost products based on their rate of consumption of the indirect cost of the company in question. It takes a keen analysis of the cost of a product. It defines the fundamental cost objects. Activity is a job or unit of task such as using machines, maintaining, setting up and designing. An activity is a process or procedure that causes work. Activity based costing underline need to attain a better comprehension of the performance of transparency costs that is, what causes fixed cost and how should they relate to goods. It recognizes that in the end, most costs are not fixed, and it therefore seeks to understand the forces that cause overheads to change over time. ABC appreciates the fact that overhead costs do not necessarily vary with the level of output (as is the belief in traditional costing systems), but most overheads vary with the range of items produced or the complexity of the production process. In ABC therefore, we use non-unit related (non-volume) bases to absorb overheads into products because they capture the complexity and the diversity of the manufacturing process, such as the relationships between volume, batch size, and order size. The need for ABC may not be clear in labor paced high volume environments because the costing errors may not be significant. However, the costing errors will be significant in automated manufacturing processes and in companies that manufacture products in highly varied lot/batch sizes because they have a high percentage of non-volume related costs.
ABC recognizes that performance of activities triggers the consumption of resources that are recorded as costs. It assigns costs to the transaction and activities performed in the organization and allocate them appropriately to the products, according to each product’s use of the activities. ABC therefore traces costs to the activities identified, then assigns the costs to products using both volume and non-volume related bases (Kerzner 2003, p. 41). A common way of applying costs to products in ABC is based on the time the inventory takes to move through a given work cell. A work cell is a product-oriented center including the machines and tools necessary to produce a family of products. Other common techniques used in ABC include the number of purchase orders, the number of material handling hours, and the number of set up hours. The ABC System constitutes the following stages: identifying the main activities in the organization that is, the main organizational activities such as machine related activities, direct labor related activities as well as auxiliary activities (such as ordering, receiving, material handling costs etc) are identified, and cost pooling which Involves the assigning of costs to cost centers or cost pools. A cost center is created for each activity such as the total costs of all set-ups might constitute one cost center for all set-up related costs and identifying the cost drivers.
Cost drivers are sources of any particular activity, which initiates it. They therefore influence the cost of a particular activity (Ogilvie, J 2008, p. 18). Cost drivers capture the demand placed on an activity by a product for example purchasing department the number of purchase orders processed, absorption of overheads to products may drive costs. Using the selected cost drivers, the overhead costs are applied and are absorbed by the products, depending on the level of activities that the product has gone through. The use of ABC therefore requires a change in the way overheads are classified by an organization. In a traditional costing system, overheads would be changed to products using at the most two absorption bases, which are usually labor hours and machine hours. ABC System, on the other hand, utilizes many cost drivers to absorb overheads into products. It is therefore claimed, and justly so, that the use of ABC produces a more realistic service or product cost, especially for service organizations and organizations with high overhead costs. McDonalds could use ABC to determine which activities in the production process consume most of its overheads and employ proper strategy to manage its overheads. McDonalds can consider its product production costs and determine which ones are more profitable. Then at this point, it can decide to produce more of the most profitable products.
Financial Appraisal Methods
Payback period method
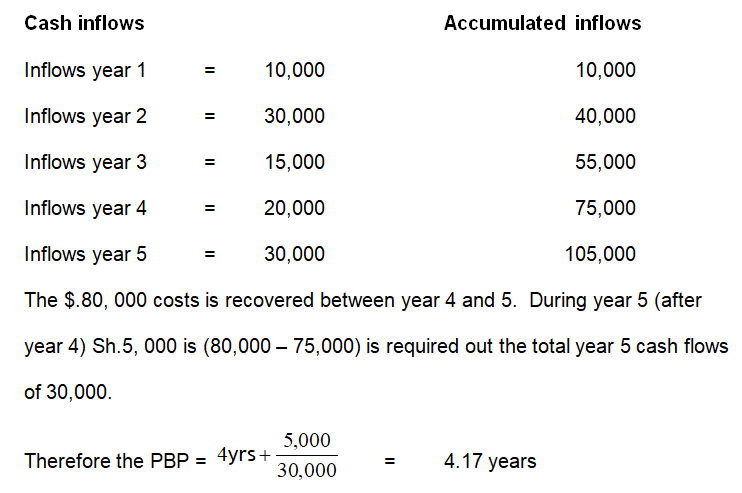
This method gauges the viability of a venture by taking the inflows and outflows over time to ascertain how soon a venture can payback and for this reason, PBP (or payout period or payoff) is that period of time or duration it will take an investment venture to generate sufficient cash inflows to payback the cost of such investment. This is a popular approach among the traditional financial managers because it helps them ascertain the time it will take to recoup in form of cash from operations the original cost of the venture. Using PBP method a company will accept all those ventures whose payback period is less than that set by the management and will reject all those ventures whose PBP is more than that set by the management. Payback period technique is most common in the private sector to measure the time it takes for a project to pay back.
Assume a project requires an initial outlay of $.80, 000 and will generate the following cash inflows:
Accounting Rate of Return Method (ARR)
This method uses accounting profits from financial status to assess the viability of investment proposal by dividing the average income after tax by average investment. The investment would be equal to either the original investment plus the salvage value divided by two or the initial investment divided by two or dividing the total of the investment book value after depreciating by the life of the project. This method is commonly used in the private sector. The rate of return on asset method or adjusted rate of return method is given by:
ARR = (Average income / Average investment) x 100
Unlike PBP, this method will ascertain the profitability of an investment and it will give results, which are consistent with those given by return ratios. Consider Project X with a cost of capital of 8%.
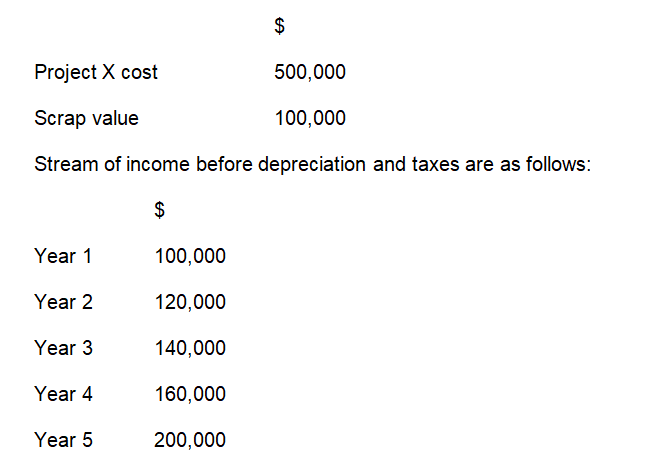
Let tax = 50% and depreciation straight line. The accounting rate of return is thus calculated as follows.
Solution
Depreciation = 500,000 – 100,000 = $.80, 000
5years.
Average income (EAT) = 32,000
Average investment = (500,000 + 100,000) ½ = 300,000
Or ARR = Average income x 100 = 32,000 x 100 = 10.67%
Average investment 300,000
ARR method will accept those projects whose ARR is higher than that set by management or bank rate and it will give highest ranking to ventures with highest ARR and vice versa. In this case project X is viable since its AAR, 10.67% is higher than the cost of capital 8%.
Net Present Value Method
The method prices inflows and outflows and determines the net current value by subtracting inexpensive outflows from inexpensive inflows to get net current cash inflows. Alternatively, the current value technique will engross choosing the rate that is suitable to the organization or equivalent to the cost of investment. This will be employed to calculate the current net inflows and outflows, as well as the net current value. The current net value will be equivalent to the current value of inflow less current value of outflow. If net present value is positive you invest, If NPV is negative you do not invest.
PV (inflow) – PV (outflows) = NPV
Under this method, a company should accept an investment venture if N.P.V. is positive that is, if present value of cash outflows exceeds that of cash inflows or at least is equal to zero. (NPV ≥ 0). This will rank ventures giving the highest rank to that venture with highest NPV because this will give the highest cash inflow or capital gain to the company. This method is widely used in the public sector since the company can afford to use the technique.
Internal Rate of Return (IRR)
This method is a discounted cash flow technique, which uses the principle of NPV. It is termed the rate, which compares the current worth of cash outflows of a venture to the original investment. IRR = PV (cash inflows) = PV (cash outflows) or IRR is the cost of capital when NPV = zero. It is also known as internal rate of return because it depends wholly on the outlay of investment and proceeds associated with the project and not a rate determined outside the venture. IRR as a technique is widely used in the public sector as well as the other modern methods. IRR will acknowledge a business enterprise if IRR is higher than or equivalent to the least rate of return. This is usually the cost of finance also known as the cut off rate or hurdle rate, and in this case, IRR will be the highest rate of interest a firm would be ready to pay to finance a project using borrowed funds. Through this, a firm would not be financially worse off by paying back the loan (the principal and accrued interest) out of the cash flows generated by that project (Eldenburg, Brooks, Vesty & Wolcott 2010, p. 65). Thus, IRR is the break-even rate of borrowing from commercial banks.
Comparison of Methods
Both traditional and modern methods will show or indicate strong weaknesses such that a company cannot use to select a viable venture and for this reason, the selection of the investment will depend on which method the company has identified it and can meet its investment needs. The choice should not be limited to one method but at least two modern methods. In all, when ranking projects, a conflict will arise between IRR and NPV, especially under the following conditions: if the lives of the projects are different, where the cash outlay is larger than the other is. The cash flow pattern differs that is, the cash flows of one project may overtime increase while those of the other decrease. In this case, NPV may give consistently correct solution especially because it does not yield multiple rates. Therefore, whenever there is a conflict between NPV and IRR, NPV will always prevail (Ogilvie 2008, p. 27). Most companies in the private sector have resulted in the use of the traditional appraisal methods such as the Payback period and Accounting rate of return whereas the companies in the public sector have opted for the use of the modern appraisal techniques such as the Net present value method, the Internal rate of return and the profitability index.
Strategic Investment Decision and Sensitivity Analysis
McDonalds’ decision to expand to Kenya shows that the variance on the sales budget and the actual is approximately 5.7%. This variance could be attributable to certain factors that were not fully explored such as customers’ response to price and the product in the Kenyan market. The 5.7% variance is unimportant and allows the company to go ahead and make the strategic investment decision. Sensitivity analysis is a method McDonalds can use to examine variations in the project’s NPV for a particular period in one of the variables influencing the NPV. It shows how susceptible the NPV is to changes in scrupulous variables. If the variable is significant, then the NPV will be susceptible to that variable. Sensitivity Analysis allows the decision maker to ask “what if” questions (Atrill & McLaney 2002, p. 16). To illustrate, let us consider an example. A project has annual cashflows of $ 30,000 and an initial cost of $ 150,000. The useful life of the project is 10 years. The cashflows of $30,000 is further broken as follows:
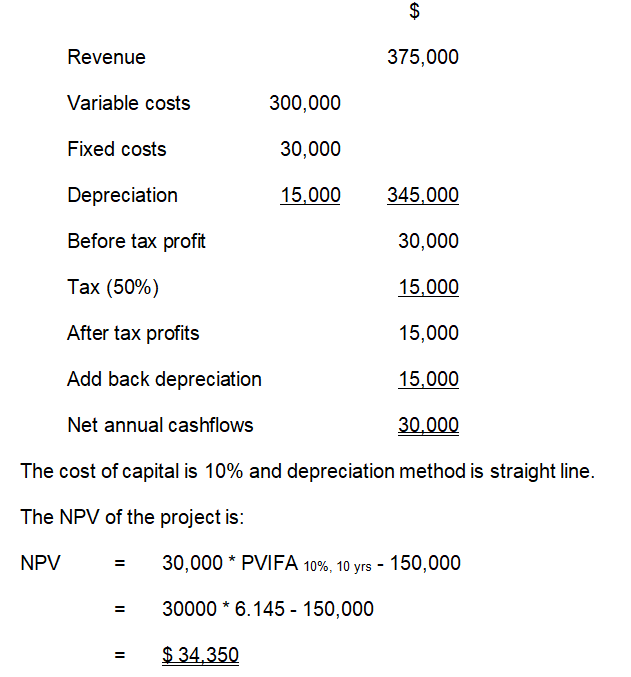
The NPV is positive and therefore the project is acceptable. However, the investor should consider how confident he is about the forecast and what would happen if the forecast goes wrong. Sensitivity can be conducted with regard to volume, price, and cost. In order to do so we must obtain pessimistic and optimistic estimates of the underlying variables. Assume that in the above example, the variables used in the forecasts are; Volume of sale (= market size x market share), Unit price, Unit variable costs and Fixed costs. Assume further that the pessimistic, expected and optimistic estimates are:
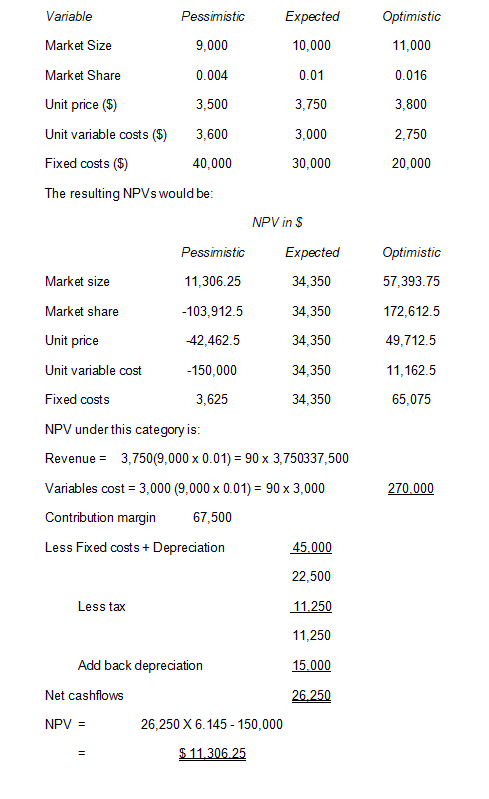
It is important to note that only one variable is allowed to vary at a time and all the others are held constant (at their expected values). It has been assumed that a negative pre-tax profit will be reduced by tax credit from the government. From the project, the most dangerous variables appear to be market share and unit variable cost. If the market share is 0.004 (and all other variables are as expected), then the project’s NPV is -$ 103,912.5. If unit variable cost is $ 3,600 (and all other variables are as expected), then the project has an NPV of -150,000. Therefore, the most sensitive factor is the unit variable cost, followed by market share and unit price. Market size and fixed costs are not very sensitive (Berry & Jarvis 2005, p. 89)
Strengths and Weaknesses of Investment Decisions in McDonalds
In my own view, should consider using three cheese slices to make their burger. With this, the double menu is available making the triple menu unavailable. This increases the range of food choices to customers with the daily affordability that they look forward to getting. Cashflow for cheeseburger would increase by 10% since people would want to get more by paying extra. However, since people look forward to saving money they would want to pay less and get a burger. This can later change according to customers’ response. The fact that McDonalds has several outlets all over the world cautions the company against currency fluctuations since it is not exposed to one currency fluctuation. However, McDonalds could not pass without its weaknesses such as there are so many competing restaurants across the globe which might make it difficult for the company to get prime locations for its expansion intention and dividend could increase but the growth rate would remain the same or even slow down. Based on these strengths and weaknesses we observe that the strengths outweigh the weaknesses.
Financial statements analysis
McDonalds’s statement of income for three years ending 31st December 2009, 2010 and 2011 shows a company with growing revenue. The total revenue for McDonalds is $22,744.7 in 2009, $24,074.60 in 2010 and $27,006.00 in 2011. The net income has also grown from $4,551 in 2009, $4,964.30 in 2010 to $5,503.10 in 2011. This shows that the company is realizing some growth in terms of its revenue. The balance sheet for years 2009 and 2010 show a company whose financial position has grown within the two years. In 2010, the Total assets of McDonalds were $32,989.90 compared to $31,975.20 in 2011. This shows a company that has increased its investment within these two years. The retained earnings of McDonalds have also grown from $33,811.70 in 2010 to $36,707.50 in 2011. This depicts a company with a growing profitability. From its cashflow statement, we are able to tell that there was a growth in cash from operations from $5,751.00 in 2009, $6,341.60 in 2010 to $7150.10 in 2011. There has been an increase in investment over the years with a bigger percentage going to capital expenditures. McDonalds has also increased its investment in less risky stock over the years with $2,797.40 in 2009, $2,698.50 in 2010 and $3,363.10 in 2011 (Hubbard 2007, p. 14).
Liquidity Ratios
These ratios show how well a company can pay some of its short-term obligations when they fall due. Looking at McDonald’s financial information for 2010 to 2011, the current ratio declined from 1.49 in 2010 to 1.25 in 2011, this shows that the company was able to cover its short-term obligations 1.49 times in 2010 and 1.25 in 2011. The acid -test ratio shows if inventory is not considered then McDonalds was able to cover its short-term debt with its liquid assets to the tune of 1.46 times in 2010 and 1.22 times in 2011 (Leo, Hoggett & Sweeting 2012, p. 67).
Profitability Ratios
These ratios show the performance of a company in terms of profitability. Proportionally, the profits of McDonalds have gone down from 21% in 2010 to 20% in 2011, even though the figure in 2011 was higher than that in 2010. In 2011, the company had a return in assets increase to 17% from 15% in 2010. This shows that the return in assets was healthy and the company was well ran in that regard.
Efficiency ratios
These ratios show how well a company does in terms of efficiency. In 2010, McDonalds had a collection period of 17.88 days, which rose to 18.04 days in 2011. This shows that the company is not doing well in debt collection. The company has improved its sales by using the existing asset as evident in assets to sales ratio. This is shown by decrease in assets to sales ratio to 1.22 in 2011 from 1.33 in 2010. The company thus uses well its assets to generate sales.
Recommendations on the strategic portfolio of McDonalds
McDonalds is performing extremely well according to its financial statements. Investing in the diversified portfolio of McDonalds using a well-managed low return approach to generate risk-adjusted proceeds is justified. McDonalds has a well-managed portfolio across the globe. Further diversification beyond favourable and unfavourable sectors would help achieve maximum profits. According to me, McDonalds would not want to invest in non-profitable operation and should take steps to rejuvenate its operations.
Conclusion
Going by this analysis, McDonalds is in the right truck towards growth. This would be achieved through expanding to other parts of the world. However, it should take the necessary steps to defeat the threats posed by the economic factors in order to remain in business. Product costing and pricing should be explored to ensure that all customers are given a consideration. With this, the company would realise better sales, as well as profits. The expansion plan by the company is highly welcome and should therefore be implemented carefully to achieve the company’s goal of profit maximization.
List of References
Atrill, P & McLaney, E 2002, Management Accounting for Non-specialists, Prentice Hall, New York.
Berry, A & Jarvis, R 2005, Accounting in a Business Context, Cengage Learning, New York.
Eldenburg, L, Brooks, A, Vesty, G & Wolcott, S 2010, Management accounting, Wiley and Sons, New Jersey.
Hubbard, D 2007, How to Measure Anything: Finding the Value of Intangibles in Business, John Wiley & Sons, New York.
Kerzner, H 2003, Project Management: A Systems Approach to Planning, Scheduling, and Controlling, Wiley, New York.
Langfield-Smith, K, Thorne, H 2009, Management accounting: information for creating and managing value, Cengage, New York.
Leo, K, Hoggett, J & Sweeting, J 2012, Company accounting, John Wiley & Sons, Sydney.
Ogilvie, J 2008, CIMA Official Learning System Management Accounting Financial Strategy, Butterworth-Heinemann, New York.
Schwalbe, K 2005, Introduction to Project Management, Course Technology, New York.
Weygandt, J, Kimmel, P & Kieso, D 2009, Managerial accounting: tools for business decision-making, McMillan, London.