Introduction
Different financial models have been developed and implemented for wind power plants in Saudi Arabia and the Gulf area in general. Engineers and economists conducted investment analysis to determine the feasibility of investing in wind power plants in Saudi Arabia’s seven sites, which include Arar, Dhahran, Abha, Solar village, Yanbu, and the Eastern province of Saudi Arabia (Al-Hadhrami 19). The power plants were based on the cost of energy as the main financial indicator, which was then analyzed using the parameters on a Weibull distribution function based on the wind density of 10 m A.G.L in the range of 50 Kwh/m2 in the inland areas and 250 and 500 Kwh/m2 in the red sea regions.
A 20 months investigation on the potential to economically tap into the energy of the wind for energy generation in Saudi Arabia showed it to be feasible because of the potential to achieve wind speeds in the range of 2.4 to 6.1ms-1 and 3.2and 5.3 ms-1 (Mohammadi and Mostafaeipour 650). This is based on the rationale that any source of energy must be designed to meet the main objective of supplying power to the people in a cost-effective, sustainable, and reliable manner. Analytical models are often based on the cost structures of different financial models such as operations and maintenance costs, the levelized costs of electricity, capital costs, the potential for renewed cost reductions, and installation costs among others.
Cost Analysis of Wind Power Plants
In theory and practice, the cost analysis of wind power plants depends on different model factors such as site description, which includes the speed of the wind, wind density, wind power density estimation, wind energy density estimation, and turbine design (Al-Hadhrami 19). That also includes the cost of the feasibility study, engineering costs, the cost of project development, and the power system costs. However, the cost structure that is used in this case depends on the technology in use for the onshore and offshore energy sources. The parameters used in this case are characterized by onshore wind speeds of 50 Kwh/m2.
Initial Investment Costs
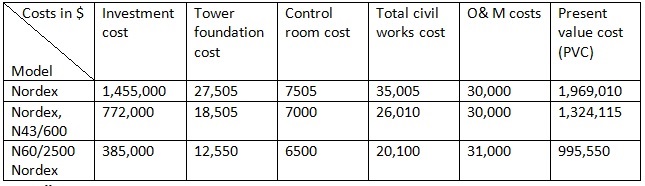
The cost parameters included in the analysis are the investment costs, often referred to as the initial costs that a company incurs. Here, such costs include the cost of purchasing wind power machinery and installation. Figure 1 reports different wind power machines that have been analyzed on a cost model that is defined by the investment cost, tower foundation cost, control room cost, total civil works cost, O& M costs, and Present Value Cost (PVC).
Installation costs
Installation costs in major markets such as Saudi Arabia range between 1 800/kW and USD 2 200/kW. Operating costs, which include site preparations, licensing, technical advice, and construction of electricity distribution grids, constitute some of the cost factors to consider.
Operations and maintenance
The cost of operations and maintenance is the third category of costs that are incurred in Saudi Arabia. During the operation of the machine, certain cost elements such as insurance, tax, operating personnel, land lease, and the ‘project self-financed’ costs lead to a greater proportion of revenue being used in the maintenance of the system. Wind data collected from 1970 up to now that was published on the Saudi Arabian Wind Energy Atlas demonstrates the rationale for using wind energy to power electricity generation.
Cost estimate models
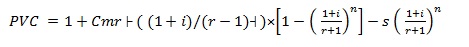
The wind power costs estimates can be determined by applying the following expression, which has been widely used in different cost analysis procedures.
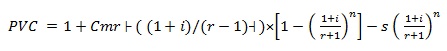
The expression parameters consist of I, the investment cost of the wind power machine, connection cable to the grid, and cost of civil works, while n is the machine life, s the scrap value, Comr is the cost of operations and maintenance, i is the inflation rate, and n is the discount rate.
Cost Analysis
Civil Construction Cost
By including the civil construction cost as well as reinforcement and labor for a 2500 kW machine, the total value could be approximately US $ 35,005. The present value of the machine could be the US $ 1,969,010 (Al-Hadhrami 20). If the PVC is divided by the total kWh for the location mentioned above, it could lead to 0.0234 US$ per kWh for the 2500 kW machine (Eltamaly 43). The technical data of the wind machine used to generate electricity based on the parameter estimates that are established using the Weibull method form the basis for calculating the civil construction cost.
Weibull Parameters Estimation
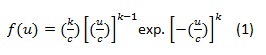
The wind speed, u, is a critical factor that defines the rotational speed and energy produced by the wind turbine (Al-Hadhrami 20). Mathematically, u follows a Weibull distribution density function that is expressed as follows:
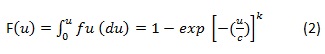
By integrating equation 1, the cumulative distribution function is obtained, which leads to the following expression. F
By taking the logarithms twice, the expression can be reduced to equation 3 as shown below.
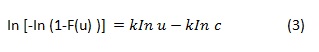
The expression takes the form of a straight line
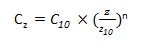
Suppose the height of 10 meters is considered for a given station in Saudi Arabia, then, the Weibull distribution values can be adjusted to take the values of C10 and k10(Al-Hadhrami 20). Using the desired height, where Z (z10=10 meters), the expression can be written as:
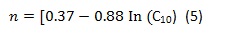
Z and Z10 take numerical height values of the site for the installation of the typical wind power plant in Saudi Arabia, with a PVC of US $ 1,969,010. This leads to the power-law exponent, n that is expressed as:
The average wind speed at different heights is a key factor used to calculate the Weibull distribution function (Al-Hadhrami 20). Weibull (k) is a dimensionless value that shows how the shape of a curve varies with the density of air and the wind speed. Once obtained, the value has an ultimate effect on the power production and cost estimate parameters.
Inflation Rate Analysis
According to Jiang, Wang, and Guan, it is imperative to make an accurate analysis of the investment in wind energy because a 0.1% error in wind speed or other parameters can lead to 2% energy and cost forecasts (810). By use of the following equation:
In this case, the inflation rate is i and r is the interest rate. If the rates are taken to be 6% and 8% respectively, the results show a positive value of the PVC of 25%, which justifies investing in the wind power energy.
Investment Model
In this model, financial assumptions are shown in table 2.
Table 2: Financial Assumptions.
Table 2 reports that if the assumption that the current mortgage rates are around 7% and an interest rate of less than 20% and greater than 0%, the debt terms are less than or equal to 30 while the marginal effective income cost is less than the highest marginal tax rate.
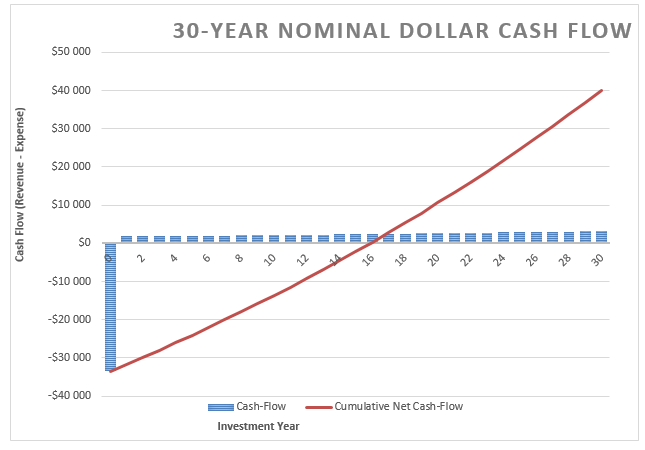
The graph shows the investment flow model, which has a payback period of 16 years. However, if the other factors such as the Power Output (kWh/year), total installed cost, and variable cost ($/kWh) are reduced significantly, then, the payback period will be reduced significantly, justifying the investment (Soe, Zheng and Aung 549).
Present Worth
Suppose a 3-year operating horizon is used to determine the present value, then, taking the year when the cash flow is zero, which in our case is 16, the present worth can be calculated as follows.
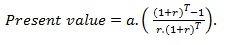
However, when t=0, then, the present worth is equal to present worth=$-35,000,000+123,000=US$34,877,000.
Future Worth
By definition, future worth (F) is the equivalent future amount when the time, t=n based on the present amount when t=0. If n=3, then the future worth is expressed as follows. By substituting values into the formula, it is possible to determine the present value as follows (Rehman, Ahmad, and Al-Hadhrami 420). This is done by taking the year 0 cash flow of $ -3.5 million using a time horizon of 3 years (T=3), and NPV of $ 123,000. It comes to:

Internal Rate of Return (IRR)
In the case being investigated, the IRR is 5%, which is below the required rate of return because the expected rate must exceed 5% and be in the range of 10% to make the project viable. The reasons for the observed IRR are because of the wind density and speed fluctuations as well as the negative effects of inflation.
Table 3: NPV.
Table 3 reports that if the rule on the use of a positive NPV that is greater than 0 with a positive cost capital that is greater than Internal Rate of Return (IRR) using a 5% cost of the initial investment, the project could have an NPV of 123.
Sensitivity Analysis
Typically, the effects of specific parameters on the cost of energy and NPV were investigated using the sensitivity analysis of the variables for 20 years. The key parameters that were varied in this case include a ±20% discount rate, debt ratio, debt interest rate, debt term, and the cost of energy (Al-Hadhrami 20). The assumptions are stated in table 4.
Table 4: Sensitivity analysis.
Table 5: Senility analysis and percentage production.
The results are fairly robust because they show the positive and negative effects of changing the prices of electricity either upwards or downwards. By changing uncertain costs that are incurred in the form of transportation and construction work based on a 3% discount rate, a positive 20-year NPV value is generated. Significant positive changes are observed even with slight variations in the price of electricity. Negative values occur for the 20-year NPV, which is affected by the pricing structure of electricity. In comparison, the 30-year NPV takes positive values. Observations show that the NPV remains constant even if the quantity of electricity is adjusted.
Conclusion
While values seem to suggest a long period that passes before the initial cost of capital is realized, it is important to note that the future worth of the project suggests that the project is worth investing in. Risk factors should also be factored to make an economically sound investment decision.
Works Cited
Eltamaly, Ali Mohamed. “Design and implementation of wind energy system in Saudi Arabia.” Renewable Energy, vol. 60, no. 1, 2013, pp. 42-45.
Jiang, Ruiwei, Jianhui Wang, and Yongpei Guan. “Robust unit commitment with wind power and pumped storage hydro.” IEEE Transactions on Power Systems, vol. 27, no. 2, 2012, pp. 800-810.
Luai Al-Hadhrami. “Performance evaluation of small wind turbines for off grid applications in Saudi Arabia.” Energy Conversion and Management, vol. 81, no. 1, 2014, pp. 19-29.
Mohammadi, Kasra, and Ali Mostafaeipour. “Economic feasibility of developing wind turbines in Aligoodarz, Iran.” Energy Conversion and Management, vol. 76, no. 1, 2013, pp. 645-653.
Rehman, Shafiqur, Aftab Ahmad, and Luai M. Al-Hadhrami. “Detailed analysis of a 550-MW installed capacity wind farm in Saudi Arabia.” International Journal of Green Energy, vol. 7, no.4, 2010, pp. 410-421.
Soe, Thi Thi, Maosheng Zheng, and Zar Ni Aung. “Assessment of Economic Feasibility on Promising Wind Energy Sites in Myanmar.” International Journal of Renewable Energy Research, vol. 5, no. 2, 2015, pp. 548-557.