In this paper I will analyze the stock price, earnings per share (EPS), dividends, and bond ratings of the various companies. There are two methods used to determine the companys stock price, namely Fundamental analysis and Technical analysis.
Fundamental analysis delves more into scrutinizing an individual company’s management, financial statements, as well as vital drivers for future growth (Rappaport & Mauboussin, 2001). This technique determines the intrinsic stock prices by analyzing various financial, economic, qualitative, and quantitative indicators such as profits, ratio of price to earnings (P/E), sales, and earnings per share (EPS).
Technical Analysis involves the use of market statistics to decide on whether to buy or sell a stock. It is also called charting technique, since it involves revisiting the trading history and statistics of a stock being analyzed (Wiedmann, 2011). In technical analysis, various indicators are used, such as moving averages, Bollinger Bands, candlesticks, stochastic, relative strength index (RSI), MACD, to mention a few, as pointers for entry and exit positions for trades.
In my analysis, I have determined that Andrews main competitor is Digby, given the fact that at the end of the simulation, the company has the highest share price which is a reflection of the company’s exemplary performance.
Analysis Based on Ending Stock Price
A company’s stock price reflects the level of investor confidence in a company. Stock prices are controlled by the free forces of demand and supply and, therefore, the higher the demand for a particular stock, the more the prices will be pushed upwards (Rappaport & Mauboussin, 2001). The analysis portrays a steady increase in the stock prices of both Andrews and Digby Company, albeit at different rates. The rate of growth of the share price is calculated using the formula:
Share price growth rate = (Final share price – Initial share price) x 100/Initial share price
Andrew’s growth in share price = (77.44 – 36.21) x 100 /36.21= 113.9%
Digby’s growth in share price = (130.36 – 41.40) x 100 /41.4= 214.9%
This clearly shows that Digby’s share price will significantly increase compared to Andrew’s and thus Digby Company will grow at a faster rate than Andrews. While Digby’s share price will be in a continuous uptrend, Andrews share will fall in 2017 to $16.93 and will plunge further in 2018 to $ 5.84 before gaining momentum again in 2019 to register at $27.51 and eventually drop a little in 2021. This fall in share price can be attributed to the Net to be reported in the financial statements of -5138 in 2017 and -9621 in 2018. Digby will make a significant leap of $26.4 from 2020 to 2021 and eventually a $30.32 from 2012 to 2022 to close at 130.36.
Analysis Based on Dividends
A dividend is a proportional payout of company’s profits to shareholders either in the form of cash, property, or common stock (Wiedmann, 2011). The dividend may either be given a quote in the form of dollars issued per each share held, or be quoted as a stock’s fair value percentage, also known as dividend yield.
From the dividends analysis, what comes out clearly is the fact that the company’s earnings go hand in hand with the dividends issued for that particular financial year. Andrews will issue a $1 dividend in 2015 and the small change in the amount of dividends to be issued by Andrews in 2015 and 2022 will indicate that it is a mature company whose earnings will have become a bit stable and growing at snail’s pace.
Digby on the other hand will start with zero dividends in the first two years, since it is a new market entrant still in the growth stage and prefers to transfer most of its earnings towards capital expenditure for purposes of expansion. However, in 2022 the tables will turn and Digby will end up issuing a dividend amount almost triple the amount given by Andrews. This shows that the Digby will be in a steady growth path and until 2022 it will still be continuing on its growth path.
Analysis Based on Earnings per Share
Earnings per Share (EPS) are the amount of quarterly or semi-annual earnings after tax and dividends for preferential stock, apportioned to every common stock within the given reporting period.
EPS = (Net income – Dividend on preferred stock)/Shares outstanding
This metric is very vital in fundamental analysis since it measures the level of profitability of a company per every common stock. This makes this indicator a major yardstick of stock prices as well as acting as a denominator for another financial indicator called the price to earnings (P/E) ratio. This is a comparison of the price a company’s share is worth currently to its EPS.
P/E Ratio = Market value per share/EPS
The smaller the P/E ratio, the better the performance of a stock, since its share price is not so high but it is accumulating huge earnings.
The simulation data clearly indicates that the EPS goes hand in hand with the net income. In 2017, Andrews will have a negative EPS due to the losses it experienced in the same periods. In 2021, despite Andrews share price having reached a high of $60.34, the company will only give out an EPS of $1.3 and this is why the P/E ratio will be as large as 46.3 as shown by this calculation: $60.34/ $1.3 = 46.3.
When Andrews issues an EPS of $8.89 against a share price of $63.1, the P/E ratio will go as low as 7.1. Digby’s EPS will increase gradually as the share price increases and at the end of the simulation, where the share price will be $130.36, the EPS will be at a high of $13.14 and the P/E ratio as low as 9.9. This shows that Digby will have a superior performance in future as compared to Andrews.
Analysis Based on Bond Rating
Bond rating is a grading system for bonds whereby it gives investors insight into the credit quality of various listed companies. Private credit reference bureaus undertake the rating based on the issuer’s financial performance, as well as its perceived ability to offer timely payments of the principal and interest to bond owners (Rappaport & Mauboussin, 2001). Rating institutions apply the same letters to indicate various grades, but differentiate them from each other by using different combinations of capital letters and small letters. AAA is the highest grade of quality credit whereas BB, B, CCC, and C are known as junk bonds or non-investment grades with very low quality of credit, and D grade are default bonds.
Year 1

Year 8

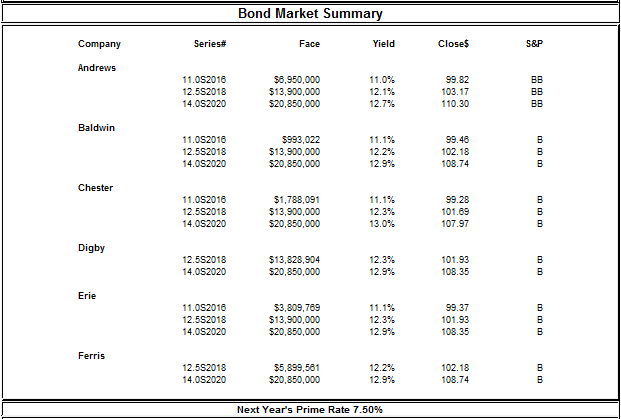
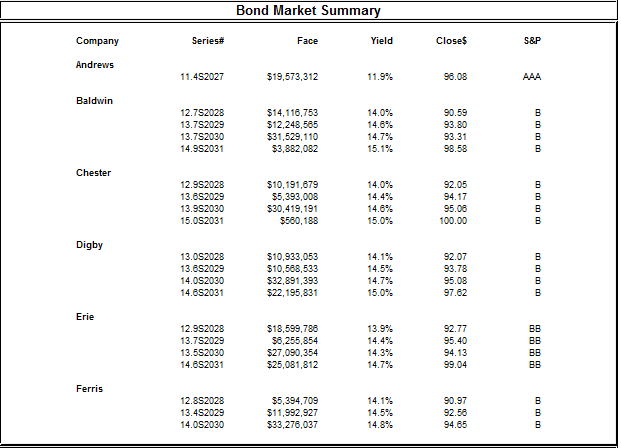
In year 1, Andrews will have a better bond rating given the fact that the company has a BB rating in all its bonds issues, while Digby has a B rating in all its bonds. The lower the bond rating, the higher the bond yield so as to compensate for a greater risk taken by investors for a lower rated bond and that is evident as Andrews bonds have lower bond yields compared to Digby’s respective bonds. In year 8, Andrews’s bond rating will be AAA and this is why it will have a lower bond yield of 11.9%. Digby’s bonds in the same period will be rated as B and thus offer higher bond yields for even bonds with higher closing values than Andrews.
References
Rappaport, A., & Mauboussin, M. J. (2001). Expectations investing: Reading stock prices for better returns. Boston: Harvard Business School Press.
Wiedmann, M. (2011). Money, stock prices and central banks: A cointegrated VAR analysis. Berlin: Springer.

