An analyst uses quantitative techniques to collect and evaluate measurable data about a company. Tesla is a car manufacturer based in the United States, which produces all-electric plug-in vehicles (“About Tesla,” n.d.). The company has faced issues with managing the demand and its production capacity since the manufacturer was unable to manufacture enough cars to meet the demand (DeBord, 2019). This paper presents an analysis of Tesla using a simple moving average (SMA) analysis and weighted moving average (WMA).
Forecasting Techniques
Tesla is a car manufacturer committed to selling all-electric vehicles only to consumers in the United States, where it resides, and globally. According to Wozniak (2020), Tesla is “the first manufacturer to reach 200,000 cumulative sales of EVs in the United States” (para. 1). However, Tesla has faced issues with meeting the consumer’s demand since its production capability was insufficient to fulfill all the orders. DeBord (2019) argues that there is no issue since the company created demand in a market that did not exist before Tesla and that the current production capabilities allow sustaining the existing demand.
Despite these claims, Bomey (2019) states that Tesla lost over $700 million in the first quarter of 2019 and then covered these losses through stocks. Partially, this is due to the company’s inability to meet the demand and produce a sufficient number of vehicles that the customers want to purchase. Thus, Tesla has successfully created a demand for all-electric vehicles but has failed to produce a sufficient amount.
The forecasting techniques will be used to analyze the trend in Tesla’s car sales and predict future demand and sales. The basis of this approach is the idea that data from the past can help predict an organization’s future performance (Illowsky & Dean, 2020). Notably, there are obvious weaknesses with this method, such as disruptions that will affect the company or the industry that have no trace in the past. With time series, analysts use simple moving and weighted moving averages to analyze the data from several periods.
Forecasting is an approach that allows using either quantitative or qualitative methods. For the analysis of Tesla, the time-series technique will be used. For this analysis, Tesla’s data on sales was collected from 2016 till 2019 for each month. Generally, Tesla has increased its sales volume, from selling 1,120 cars in January of 2016 to selling 8,000 cars in the same month of 2020 (Wozniak, 2020). However, for clear trend analysis, one should use statistical techniques. Below, in Table 1, the data for the selected period is presented.
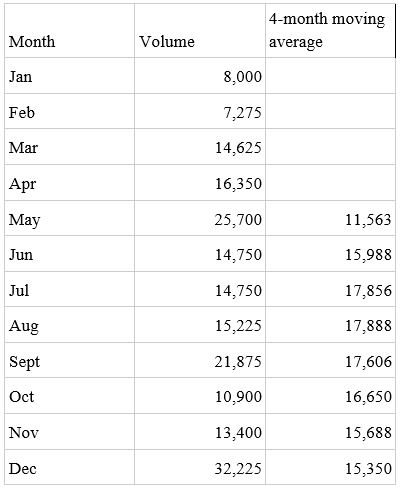
Table 1. Tesla’s sales volume (based on data from Wozniak, 2020).
The moving average analysis can be applied for data from short periods. This is low complexity and low data requirement analysis. Hence, there is no need to use monthly or weekly data for all the years. For this analysis, the monthly data for one year will suffice. For this analysis, the demand for Tesla’s cars will be calculated using the data from 2019 sales by month (Illowsky & Dean, 2020). Based on the simple weighted analysis, Tesla clearly shows a trend for increased sales, which is most likely associated with the increased demand for these vehicles. Moreover, the company has shown remarkable growth in sales from 2015 till 2019.
SMA analysis allows determining an average from the selected data by the number of periods (Hayes, 2020). This technique is useful because it allows making calculations for different timeframes by adding new data, such as new demand figures, and removing the information from the outdated period. For Tesla, the results of a 4-month SMA are presented in Table 2. The calculations for the 4 months were one using Google Spreadshit’s built-in features (Du, 2020). The results show a significant difference between the 4 months sales for Tesla cars, with the peak in sales happening during the summer and the least sales during winter.
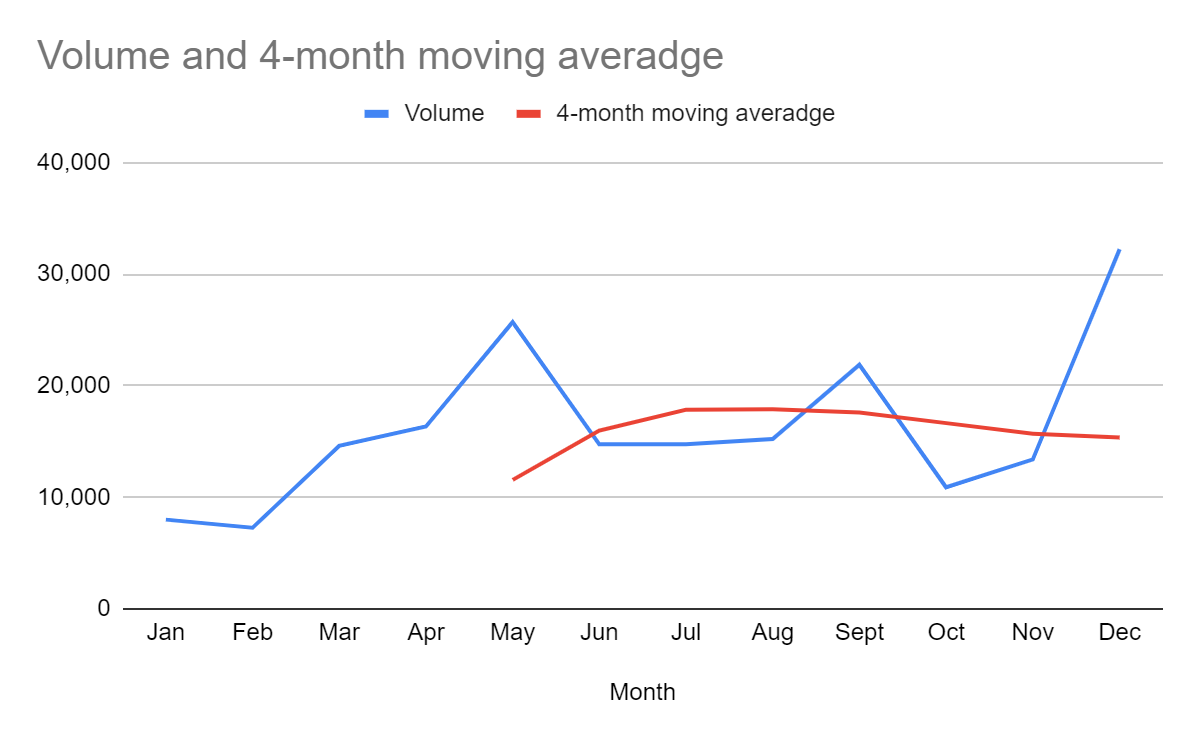
Next, Figure 1 presents a chart with the results of SMA for Tesla. The red line on the chart represents the general trend in sales, while the blue line is the actual sales. From this figure, one can conclude that there is significant variability in sales for Tesla’s cars, but on average, one can forecast that the manufacturer will sell between 11,000 and 19,000 units each month. Based on this analysis, one can make assumptions regarding the sales of Tesla cars within the following periods.
The second quantitative technique of analysis is WMA. Unlike SMA, in WMA, one assigned period SMA values for each period (Ganti, 2020). The data points from periods that are older have less value than those that are more recent (“Weighted moving average,” n.d.). Hence, this analysis allows accounting for some changes in trends. For each period, the following additional values were used: wt1=0.1, wt2=0.5, wt3=4, with an assumption that the second two periods are more important for sales. Hence, the results are presented in Table 4 below. One can see that the sales results for some periods differ from those in Table 3 because, in this analysis, certain months are considered more important than others.
Table 3. WMA for Tesla (created by the author).
Overall, based on this analysis, one can conclude that Tesla’s sales and demand for their cars are continuously increasing. The trend analysis based on SMA and WMA helps the trends in car sales. Based on the results of SMA, the manufacturer should sell between 11,000 and 19,000 units per month. Also, the results of WMA are presented in this paper to illustrate how assigning weights to some periods can change the output. By using the SMA and WMA analysis methods, one can forecast the future sales of Tesla’s cars and ensure the company does not face issues with fulfilling orders due to high demand.
References
About Tesla. (n.d.). Web.
Bomey, N. (2019). Tesla electric car demand is ‘not’ struggling, Elon Musk says amid investor concerns. USA Today. Web.
DeBord, M. (2019). Elon Musk thinks it’s ‘financially insane’ to buy a car that isn’t a Tesla — but Tesla wouldn’t be able to make enough cars to meet that demand. Business Insider. Web.
Du, K. (2020). The ultimate guide to calculating a simple moving average in Google Sheets. Web.
Ganti, A. (2020). Weighted average. Investopedia. Web.
Hayes, A. (2020). Simple moving average (SMA). Investopedia. Web.
Illowsky, B. & Dean, S. (2020). Introductory statistics. OpenStax.
Weighted moving average. (n.d.). Web.
Wozniak, K. (2020). Tesla U.S. sales figures. Car Sale Base. Web.