Introduction
This paper seeks to compare Urban Outfitters, Inc, (URBN) with Tiffany & Co. (TIF) under the retail business industry using their annual reports and other appropriate source materials. In making the evaluation and comparison of the two companies. This paper will analyze their business environment, their strategies and their financial position and performance
URBN as a lifestyle specialty retail company, operates specialty retail stores under the Urban Outfitters, Anthropologie, Free People, and Terrain brands. Its Urban Outfitters stores offer women’s and men’s fashion apparel, gifts, footwear and accessories. URBN stores also deal on mix of shower curtains, books, apartment wares, such as rugs, pillows, candles and novelties for young adults. One the other hand, its Anthropologie stores make available to customers women’ casual apparel and accessories, and a range of gifts and decorative items.
They also offer rugs, lightning products, beddings, and gifts for women as part of home furnishings. URBN’s Free People retail stores on another part, primarily make available Free People branded merchandise, as could be found in casual women’s apparel, gifts targeted to young contemporary women, accessories. Terrain retail stores as separated do offer lifestyle home and garden products combined with antiques, live plants and flowers. Parts of the latter products are the different landscape and design service solutions for men and women.
As URBN designs, develops, and market private apparel lines of young women’s casual wear, in tops, bottoms, sweaters, and dresses, one could prove its wide coverage in approximately 1,800 department and specialty stores. This is further expanded by offering its products directly to consumer via online using various websites as urbaboutfitters.com, anthropologies.com, and urbanoutfitters.co.uk. With more than 140 Urban Outfitter stores, 121 Anthropologies stores and 30 Free People Stores, the company is evidently big and continues to grow big.
On other hand, Tiffany & Co, which is based in New York, New York, has its many subsidiaries and through them, the company is engaged in the design, manufacture, and detail of fine jewelry. The company is still considered as part of the retail business and instead of dealing with apparels as that of URBN, TIF has its jewelry products. From this wide array of jewelries come the gemstone jewelry and gemstone and band rings, diamond rings and wedding bands for brides and grooms, and non-gemstone, gold, or platinum jewelry, as well as sterling silver jewelry.
TIF is also known for its offer of TIFFANY & CO. brand merchandise that may be noticed in timepieces and clocks and sterling silver merchandise, such as those in trophies, key holders, flatware, hollowware, desks accessories, picture frames and even writing instruments, fashion accessories and eyewear products. Thus, it marketing strategies become evident with its customers through retail sales, business-to-business direct selling operations, and catalogues. It also actively engaged in wholesale distribution in the US and internationally. TIF has also its products sold through TIFFANY & CO stores in many part of US and department stores boutiques in Japan. It expansion becomes evident by having operated and approximate of 206 retail store worldwide as of 2008 after it was founded in 1837.
Financial Analysis
An instant picture of how well the companies perform financially is accomplished via financial analysis by using its financial ratios as summarized in Table 1 below which is segmented into, liquidity, profitability and efficiency, liquidity solvency and market ratio analysis.

The Common Size income statements of the companies would appear as follows:

Profitability and Efficiency
URBN’s profitability appears almost the same as that of TIF based on net profit margin for the years 2009, 2008 and 2007, at the former’s 11%, 11% and 9% respectively or an average of 10 % as compared with TIF’s 8%, 11% and 11% s for the same years respectively, or an average of 10%. However the same behavior is no longer observed in terms of operating margin as URBN has become less profitable at 16%, 15% and 13% for the years 2009, 2008 and 2007 respectively or an average of 15% as against TIF’s 13%, 19% and 18% for the same years respectively or an average of 17%. The lower profitability becomes more convincing even in terms of gross margin where TIF has definitely shown lower rates. Among the three margins, net profit margins speak clearer because at that level, all expenses were already deducted from revenues.
Given the similar average of 10% in net profit margin for the two companies, there is therefore need to decide which is better using other profitability ratios. The Return of Assets for URBB is 15%, 14%, and 13% for the years 2009, 2008, and 2007 respectively with an average of 14%. These rates are higher than that of TIF, which reflected ROA of 7%, 11%, and 10% for the same years respectively or an average of 9%. The results of ROA appear to modify earlier observation of similar average net profit margin for the last three years.
This time URBN is more profitable. By checking further on their profitability in terms of Return of Equity (ROE) where URBN showed 16%, 20% and 23% for the years 2009, 2008 and 2007 respectively, or an average of 20%, which are definitely lower than that of TIF which showed 101%, 80% and 64% for the same years respectively or an average of 81%. Finally, TIF should be declared more profitable since ROE measures how much management is compensating resources invested by stockholders while ROA measures how efficient management of company was in terms of assets employed in business.
In terms of efficiency URBN appears better because despite its lower gross margin, it was able to control operating expenses to make their net profit equal on the average for the past three years. This better efficiency is further supported by higher ROA of URBN than TIF and better inventory turnover ratio of about 80 days on the averages as against TIF of more than one year or 365 days. See Table I above.
As a rule, every business should have profitability as its primary goal in all of its business ventures for which the business will not survive in the long-run.
Basically profitability is only measuring income and expenses. Every company wants to have higher income than expenses. It is simple however to take relationship of the two accounts since it could happen that expenses become higher than income. Before comparing the two companies, it must be made clear that income is money generated from the activities of the business entities, which cost something, and these are called expenses. Before expenses could be incurred however, the business entities need to acquire assets as what were done by URBN and TIF.
T Said assets either could come from the investment of the owners or from the assets provided by the company creditors. Profitability is produced in the income statement with the desired effect of having more revenues over expenses. The said accounting information could however be further manipulated by converting them into many ratios as used in the case of both companies for this paper.
Liquidity
The company’s liquidity shows the capacity of the company to meet its currently maturing obligations and the same could be measured by the quick ratios and current ratios. URBN’s quick ratios showed 2.85, 1.27, and 1.33 for the years 2009, 2008, and 2007 respectively or an average of 1.82 as against the TIF’s quick ratios of 0.54, 0.75, and 0.79 for the same years respectively, or an average of 0.69.
A different behavior of the company’s liquidity may be observed in terms of current ratios with URBN’s current ratios reflecting 4.42, 2.59, and 2.71 for the years 2009, 2008 and 2007 respectively or an average of 3.24 as against TIF’s current ratios of 3.40, 3.29, and 3.77.
for the same years respectively or an average of 3.49. URBN’ most recent current ratio is higher than TIF but the latter had higher average for the last three years.
In comparing quick ratio from current ratio, it may be noted that quick ratio is better measure for liquidity since the same excludes inventory in the composition of the quick assets. Thus, URBN must be declared to be more liquid than TIF.
As a general guide for a company to have a good liquidity, the ratio of current or quick assets to current liabilities should be at least one (1.0) since this would mean that a company must be able to match 1 US dollar from it current assets to every US dollar of its currently maturing obligations. Failure of a company to do such could mean bankruptcy and may force the company to stop operation. Such is logical expectation since the salaries of its employees, which must come every payday, cannot wait longer for people need to have their living expense. The ready quick assets there of a typical company to match maturing obligations include cash, marketable securities, short-term investments, accounts receivable, and notes receivable. To make quick assets into current assets, one may just add inventory from the listing.
Applying such knowledge then in the case of the URBN and TIF, it may be noted that quick ratios of URBN are above 1.0 while that of TIF are less than 1.0. Thus on a safer note, URBN is then more liquid. As quick asset ratio is more refined ratio than current ratio, the same normally carries a lower figure than that of the current ratio, as confirmed in TIFs analysis.
What may be surprising to note is the higher liquidity of URBN as compared with TIF despite the almost greater profitability of TIF as earlier analyzed in terms of ROE and the operating margin and gross margin. This could be explained by the fact that TIF was trying to improve its liquidity and indeed, it had it liquidity very high using current ratio of more than 3.0, which is already very high. What the company appears to have neglected was its decreasing quick ratio for the past two years.
Solvency
In the language of finance, solvency like liquidity has also something to do with the ability of an enterprise to pay its debts with available funds like cash which is presumed to exist but This time it is different from liquidity since solvency must be long term or it must speak for the financial stability of the company to survive short term problems at it has sufficient investment from stockholders to match long term debt of the company together with currently maturing obligation.
It is also a different concept from profitability, as the former refers to the ability of a company to earn a profit so businesses may show a profitable result of its operation without being solvent as in the case where these companies are on the stage of expanding rapidly in the early part of business. On the other hand business entities can be solvent even while not being profitable like when they try destroying future cash flows, as may be found when accounts receivable are being sold. Thus ideally a company must be both profitable, liquid and solvent since a business gets bankrupt when it is losing money due to unprofitability and could eventually become insolvent. Solvency may be measured using debt to equity ratio.
Applying the knowledge in the case of the company, debt to equity ratios for URBN are 0.26, 0.34 and 0.33 for the years 2009, 2008 and 2007 respectively or an average of 0.31while TIF has reflected debt to equity ratios of 0.95, 0.75 and 0.58 for the same years respectively, or an average 0.76. The ratios are better this time for the companies if they are lower. Thus, URBN is more solvent because lower ratio means lower risk. Theoretically, companies do avoid risk but profitability is normally increased with the higher risk.
Since TIF is more profitable than URBN as compared earlier, it could mean that the higher risks from faced by TIF was being compensated or balance by higher profitability. But since the two company have debt to equity ratios of still below 1.0, they could be considered as still not too risky and the possibility of expanding in the future could still be entertained financially speaking.
Market ratios
Market ratios measure how well the stocks of the company are valued by the stockholders. In financial management theory, management tries to maximize the wealth of stockholders and the best measure of attaining the objective is valuable are the stocks in relation to earnings, book values and risks. As shown below, URBN appears inferior to TIF because of lower price –earnings ratio and lower market to book ratio. However, this researcher gives more weight to the lower beta that would less volatility of its price in the stock market as a sign of greater solvency than that of TIF.
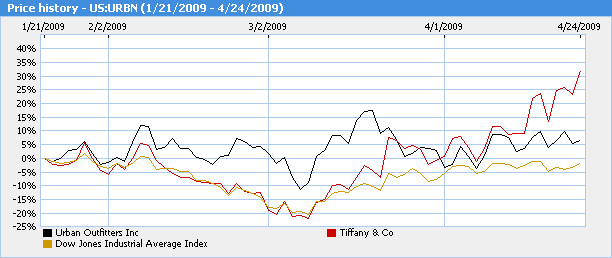
The conflicting market performance of the two companies could be better appreciated by observing the behavior of the stock prices as for that last three to four months (See Appendix A) as compared on how they may have behaved for last the five years (See Appendix B).
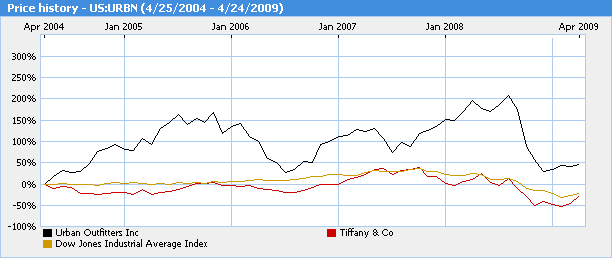
The better market to book ration for TIF based on the most recent data compared with URBN could be seen in Appendix A where traditionally URBN has higher than TIF’s performance, the recent events show some indication of TIF surpassing URBN in April 2009. However, if the graph is viewed for the five-year period in Appendix A, the short time higher market to book value for TIF is almost not noticed. This would mean that on the overall, URBN is more stable and has even exceeded the Dow Jones Index for at least five years but TIF is just showing a recent rise in value.

Discussion and comparison of unusual or aggressive accounting policies, practices, footnotes, etc and their impact, if any on evaluation and comparison
The management Tiffany has mentioned about its adoption of non-GAAP measures of some its accounts on those affecting its international operations. It mentioned in said 2008 Financial Results prefers to use the constant-exchange-rate basis as opposed for the need to reflect the changes in exchange rates under the GAAP. GAAP stands for generally accepted accounting principles and they represent those standards that are used for external reporting across different companies in different industries as the more objective basis of financial reporting.
From the point of view of the reader of the information submitted by Tiffany to the public, there could be option to adjust the financial statements of the company for purposes of making an analysis for investment purposes. However, this researcher takes the position that following the requirements of the GAAP is a safer course to take for purposes of establishing the reliability and usefulness of the financial statements of Tiffany. Moreover, the independent auditor of the company has indicated that the financial statements of the company present fairly the results of operation and financial condition as of the period covered in the audit.
This researcher takes therefore such professional unqualified opinion as a more objective standard to establish the reliability of the financial statements rather than management belief that adoption of what the company used for internal management is also good for users outside the company.
Since this researcher finds also the financial statements statement of URBN to have presented fairly the results of operations and financial condition of the company as of the date audited, there is no need to make adjustments to the financial statements as basis for the decision making. In other words, what have been used as financial ratios in the analysis came from the audited financial statements without any adjustment made by this researcher before the analysis was made.
Conclusion
Given the better profitability and better liquidity in terms of current ratios of TIF than URBN investing in its stock may be a good idea to be entertained. The average rates of 81% on return on equity for the last three years is more than three times of that of URBN. TIFs is however the company that is less solvent than URBN but standing alone the company has still a very solvency ratio at debt to equity of below 1.0. In terms of liquidity, both companies may be considered as liquid by strictly speaking, URBN is more liquid because of its quick ratio more than 1.0 while that of TIF is below that cut off.
However, given the above 3.0 current ratio of TIF, the said company may still assure it creditor that it can pay on time. Given this situation of more profitable TIF but more liquid and more solvent URBN, there is a need to look at the market ratios of the two companies.
As found, TIF has higher price-earnings ratio and market to book which mean that the company has performing better based on most recent figures as shown in appendix A. However when viewed in a more expansive graph by covering a five year period the most recent better performance of TIF as against URBN has become almost insignificant since obvious URBN could prove that it has been performing well in the last five years and even has done the same above Dow Jones Index. For the company to be performing even during the existence of recession is an indication that the company is table while that of TIF may just responding to what is happening in the economy which may not be necessarily true in the long-run. This researcher therefore still recommends investing with URBN rather than TIF.
Appendices
Appendix A. – Stock price graph of URBN compared with Dow Jones and TIF for past 3 to 4 months.
Appendix B- Stock Price Graph in Five Years
Appendix C – Summary of Financial Data and Ratios

Bibliography
- Brigham, E. and Houston, J., Fundamentals of Financial Management, Thomson South-Western, US, 2002.
- Business Wire, Tiffany Reports 2008 Financial Results, 2009.
- Meigs, R,. Meigs, W., & Meigs, M. Financial Accounting, McGraw-Hill, New York, USA, 1995.
- MSN , Stock Quote for URBN, 2009c.
- MSN ,Stock Price Graph, For the last Five Years, 2009f.
- MSN, Stock Price Graph, For the last Three to Four Months, 2009e.
- MSN, Stock Quote for TIF, 2009d.
- MSN, Annual Reports for 2009 and 2008 of Tiffany and Co. , 2009b.
- MSN, Annual Reports of Urban Outfitters, Inc for 2009 and 2008, 2009a.
- Van Horne, J., Financial Management and Policy, Prentice-Hall International, USA, 1992.
- Yahoo finance , Company Profile: Urban Outfitters. Inc., 2009a. Web.
- Yahoo finance, Company Profile: Tiffany & Co., 2009b.