Adjustment of Errors
Inventory Error
Accounting errors should be adjusted as soon as they are found. An inventory error is corrected by making adjustments on the cost of sales and the inventory balance (Chapter One, 2012). The stock’s errors have an opposite effect on the cost of sales and the inventory balance. Accountants correct inventory understatement by adding to the inventory balance and subtracting from the cost of goods sold the amount by which it has been understated. When inventory is overstated, the accountant will reduce the inventory balance and increase the cost of sales by the amount of understatement (Hey-Cunningham, 2006, p. 19).
In the case at hand, inventory has been overstated by $ 10,000. This error will be corrected by reducing the inventory balance and increasing the cost sales by $ 10,000 as shown here below:
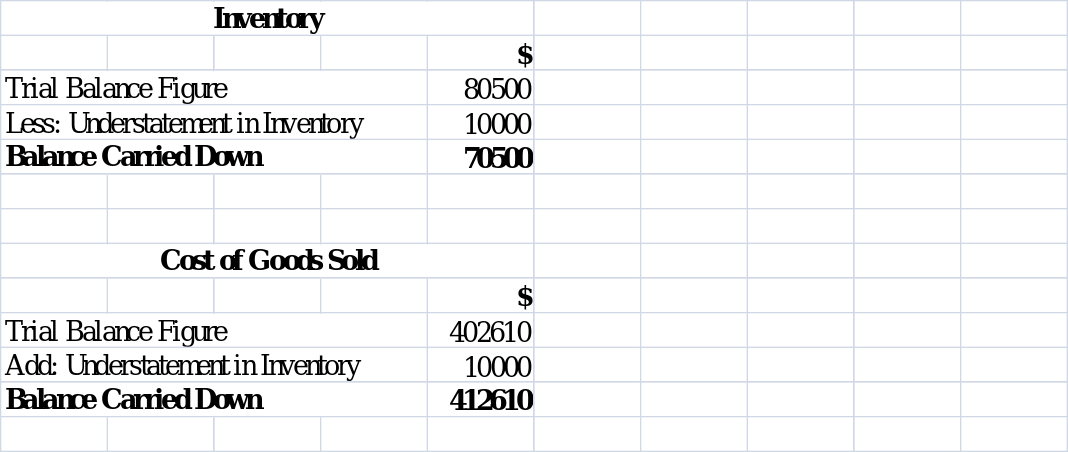
An inventory error impacts both on the income statement and the statement of financial position (Chapter One, 2012). It leads to incorrect computation of the cost of sales and consequently, the gross profit and net income. If left unattended, the error produces the converse impact on the cost of sales, gross and net profit in the subsequent accounting year because the previous year’s closing stock is the next period’s opening stock (Hey-Cunningham, 2006, p. 12).
The inventory of Costa Company is overstated by $ 10,000; this leads to the understatement of the cost of sales and overstatement of the gross profit and net income by the same figure. In the subsequent year, 2013, Costa’s cost of inventory sold would be exaggerated by $ 10,000 while the profit would be understated by the same amount.
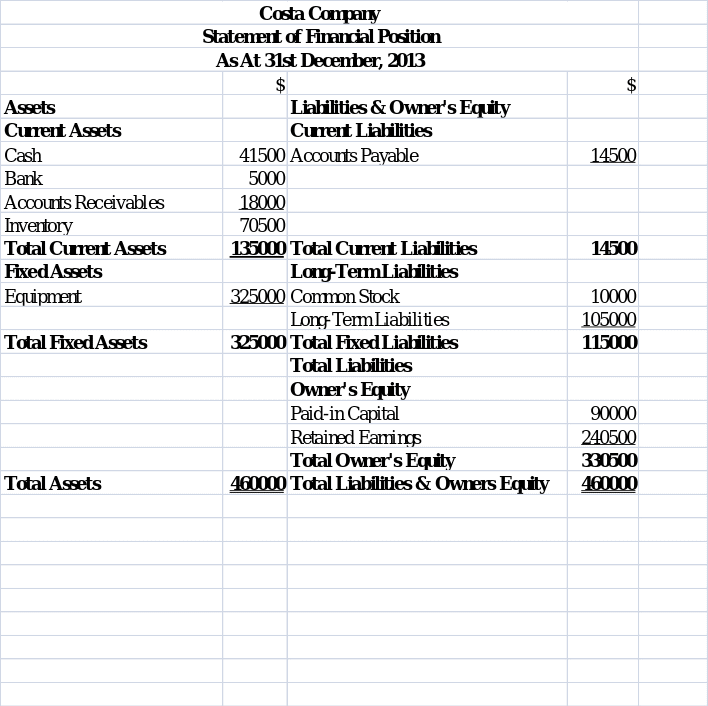
In the statement of financial position, an inventory error leads to an understatement or overstatement of the inventory component of the balance sheet. If the inventory is undervalued, the assets and the owner’s equity in the firm will be understated, and the converse is true. At Costa limited, the closing inventory is overstated by $ 10,000. If the error is not amended, the firm’s assets and the shareholders’ equity will be overstated by the same amount.
Omitted Sale Transaction
The omission of the sale transaction led to the understatement of the enterprise’s revenue and assets. The error is adjusted by increasing the sales and assets figures by the amount so omitted (Hey-Cunningham, 2006, p. 21). At Costa limited a sale transaction valued $ 5000 was omitted from the firm’s accounts. Its effect is the understatement of the enterprises revenue and the current assets. The error is adjustable by increasing the revenue and current assets figure by $ 5000. When the check is accounted for a new asset, a bank, with a balance of $ 5000 will be added to the list of current assets. The adjustments are shown in the spreadsheet here under:
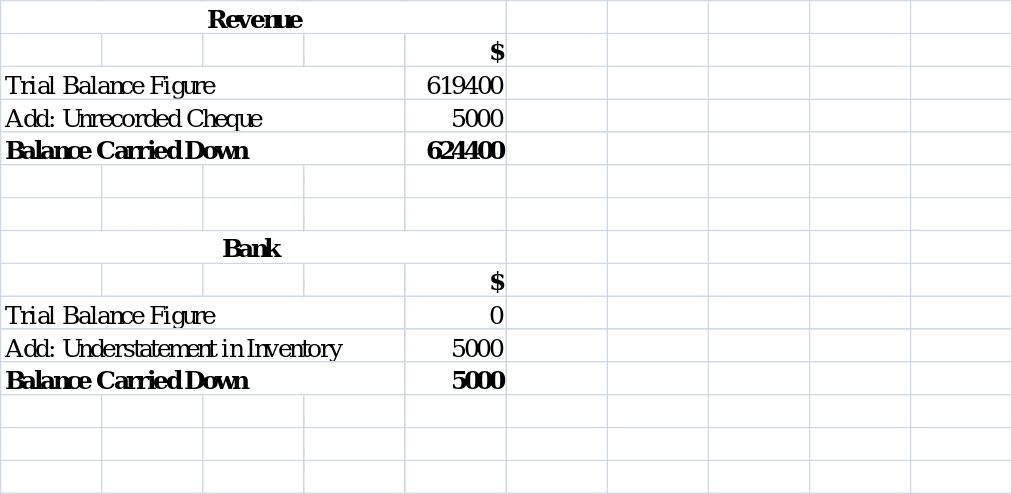
A sale transaction omission error impacts both on the income statement and the statement of financial position (Hey-Cunningham, 2006, p. 23). It leads to incorrect computation of the revenue and consequently, the gross and net profit. If left unattended the error leads to the understatement of the current and subsequent year’s revenue, owner’s equity and assets. The omission of the sale transaction at Costa Company leads to the understatement of the firm’s sales, gross income and net profits by $ 5,000.
In the statement of financial position the omission of the sale transaction leads to the understatement of the firm’s current assets and owner’s equity. The check $ 5,000 received is reflected in the current assets component. The firm’s retained earnings and therefore, the owner’s equity, are also understated by the same amount.
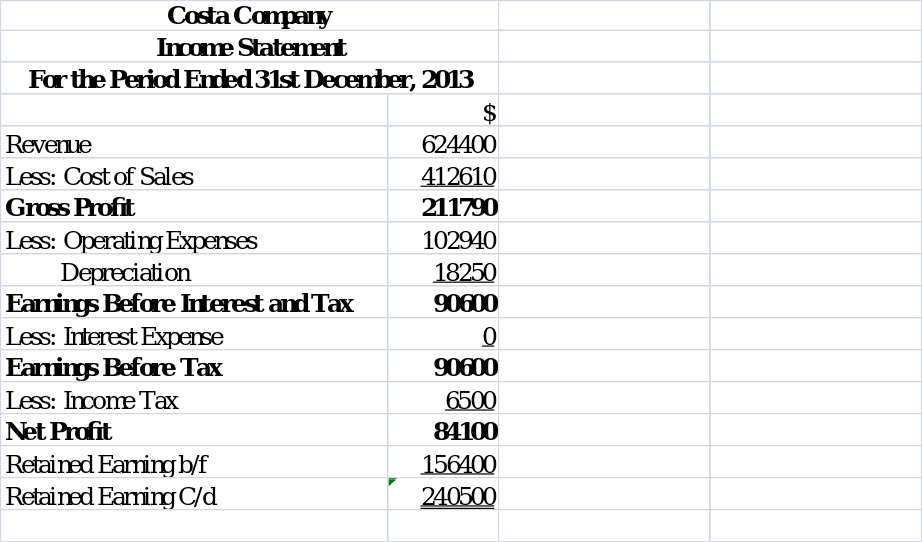
Income Statement
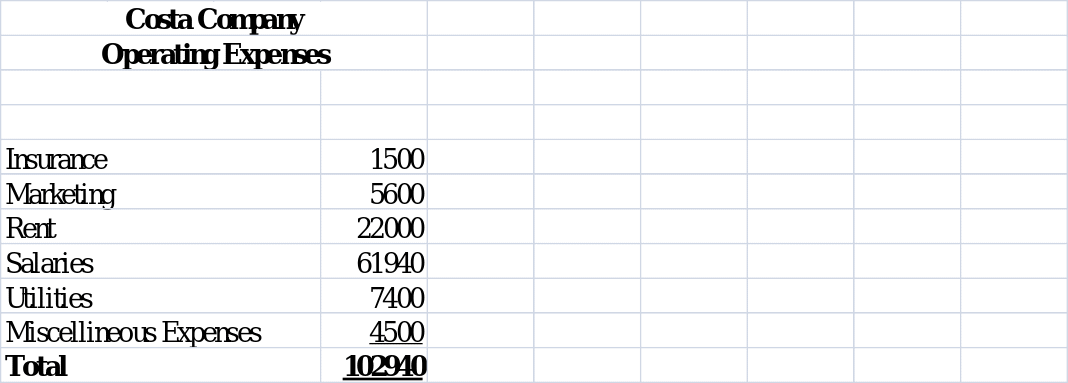
Working: Operating Expenses
Statement of Financial Position
Company Profitability
A company’s profitability is established with the aid of profitability ratios. Some of the widely used profitability ratios include: gross profit margin, net profit margin, return on assets, earning per share, return on capital employed and return on equity among others (The City University of New York, 2008). The following ratios have been computed to assess the profitability of Costa Company:
Gross Profit Margin: The ratio is a quotient of gross profit and sales. Gross profit is determined by subtracting the cost of sales from the sales. Gross profit margin shows a firm’s efficiency and effectiveness in production The City University of New York, 2008). The ratio is usually compared with a set or industrial standard.
Gross Profit Margin = Gross Profit / Sales = 211790 /624400 = 0.3392
Net Profit Margin: The ratio is a quotient of net profit after tax and sales. Gross profit margin shows a firm’s efficiency and effectiveness in production, administrative and selling functions (Sheeba, 2011, p. 131). The ratio is usually compared with a set or industrial standard.
Net Profit Margin = Net Profit / Sales = 84100 /624400 = 0.1347.
Return on Equity: The ratio is a quotient of the profit after tax and net worth. Net worth or Equity is made up of the share premium, reserves and paid up capital (Sheeba, 2011, p. 132).
ROE = PAT / Net Worth = 90600 / 330500 = 0.2741.
Return on Investment: The ratio is a quotient of the profit before interest and tax and total assets (Sheeba, 2011, p. 131).
ROI = EBIT/ Total Assets = 90600 / 460000 = 0.1970
The above four ratios provide a general view of Costa’s profitability. Lack of benchmarks makes it difficult to determine in absolute terms the profitability of Costa. Notwithstanding, the firm seems to be efficient in its production activities. Regarding the utilization of assets, Costa has not being fully using its assets to obtain value for the firm.
Financial Position
A company’s financial position is determined using liquidity and leverage ratios (Chapter One, 2012). Liquidity ratios are applied to establish a firm’s ability to honor its short-term debts as and when the fall due. Liquidity ratios are therefore widely used to determine a firm’s ability to be in business The City University of New York, 2008). The following liquidity ratios have been used to evaluate Costa’s financial position:
Current Ratio: This is the quotient of current assets and current liabilities. It is used to determine the ability to meet short-term debts from the most liquid assets (Sheeba, 2011, p. 121).
Current Ratio = 135,000/14,500 = 9.3: 1
Quick ratio: the ration is obtained by dividing the value of the most liquid assets with the current liabilities. Inventory is excluded in the calculation of this ratio (Sheeba, 2011, p. 121).
Quick Ratio = (135,000 – 70500)/14,500 = 4.4483: 1
Cash Ratio: it is the most stable liquidity ratios among the three discussed in this paper. The ratio compares cash and its equivalents to current liability (Chapter One, 2012).
Costa’s cash ratio is calculated as follows:
Cash Ratio = (41500+5000) / 14500 = 46500 / 14500 = 3.2069: 1
The liquidity ratios reveal that Costa is capable of meeting the short-term debts as they fall due. Nevertheless, a substantial investment is locked up in current assets.
Leverage or gearing ratios are used to determine the suitability of a firm’s financing methods. The main aspects considered when evaluating a company’s leverage include assets, equity, interest expenses and debt (Sheeba, 2011, p. 124). The ratio below has been used to evaluate Costa’s leverage:
Debt/ Equity: the ratio compares short-term and long-term debt to equity.
Debt/ Equity = 129500/ 330500 = 0.3918
Costa’s financial risk is low because its liabilities can easily be met from the firm’s assets.
References
Chapter One: Welcome to the World of Accounting. (2012). In I. Walther (Ed.) Principles of Accounting. Web.
Hey-Cunningham , D. (2006). Financial Statements Demystified. Sydney: Southwood Press.
Sheeba, K. (2011). Financial Management. New Delhi: Pearson.
The City University of New York. (2008). Guide to Financial Statements. Web.

