Introduction
Economists have developed numerous parameters that they use in assessing economic performance of a country, a stock market, or a company. The gross domestic product (GDP) is an economic parameter that measures economic performance of a country whereas the Standard & Poor’s 500 (S&P 500) is an economic parameter that measures stock performance of the American market. Since these two parameters measure economic performance, they have positive relationships, which illustrate the trend of economic growth. GDP is an appropriate economic parameter of performance because it assesses the market value of services and products that a country generates in a given time.
S&P 500 is an effective economic parameter of measuring the United States stock market because it considers and pools market capitalization of the leading 500 companies that trade in the New York Stock Exchange. Since companies are drivers of economic activities, it implies that the stock market determines their activities, which in turn affect GDP of a country. Comparison of the GDP of the United States and the S&P 500 demonstrates the influence of the stock market on the national economic performance. In this view, this research paper hypothesizes that there is a strong correlation between the GDP and the S&P 500 because stock market is a statistically significant predictor of economic activities.
Literature Review
The GDP and the stock market are major economic parameters that assess economic growth and development of a country. Fundamentally, there is a contention regarding the relationship and the influence of these economic parameters on each other. Some studies demonstrate that the GDP influences stock markets while other studies demonstrate that the stock market affects the GDP. In their study to determine the effect of economic indicators on stock markets, Plachy and Rasovec (2015) found out that GDP, as well as the unemployment rate, interest rate, inflation, import rate, and export rate are economic indicators that influence the development of stock markets. However, their influence varies from one country to another depending on the prevailing economic indicators.
An opposing view holds that stock market influence GDP by mediating consumer confidence and financial conditions. When the stock market is bullish, investors flood the market, hire extra workers, invest in additional projects, and expand their business activities, resulting in increased GDP (Masoud, 2013).
In a bullish market, consumers tend to increase their purchasing power and accumulate wealth. In contrast, during a bear market, stock prices tend to go low forcing companies to adopt cost-cutting measures such as reducing production and management of a lean workforce. Furthermore, consumer spending declines and unemployment rates increases, causing adverse effects on the GDP. According to Masoud (2013), the stock market and economic growth have a causal link because they have an intricate positive relationship. The relationship shows that the stock market reflects the long-term or the short-term economic growth of a country. As stock markets pool finances, they make them available for the production of goods and services in various sectors and industries.
Methodology
The study employed secondary data obtained from reputable online databases that have valid economic data. The GDP data of the United States were retrieved from the database of the World Bank Group (“Data: GDP (current US$),” 2017). The data have yearly values of GDP for 263 countries across the world from 1960 to 2016. To obtain the appropriate data, the United States was selected as well as its GDP values since 1960 to 2016. The data of S&P 500 were retrieved from an online database (“Standard and Poor’s (S&P) 500 Index data,” 2017). The data contained monthly values of S&P 500 index from 1871 to 2017. To allow reasonable comparison, the study calculated average annual S&P 500 indices and selected data from 1960 to 2016 (57 years), which matched the period of the United States’ GDP selected. In determining the relationship, the study made S&P 500 index the dependent variable and the GDP of the United States the dependent variable.
Data
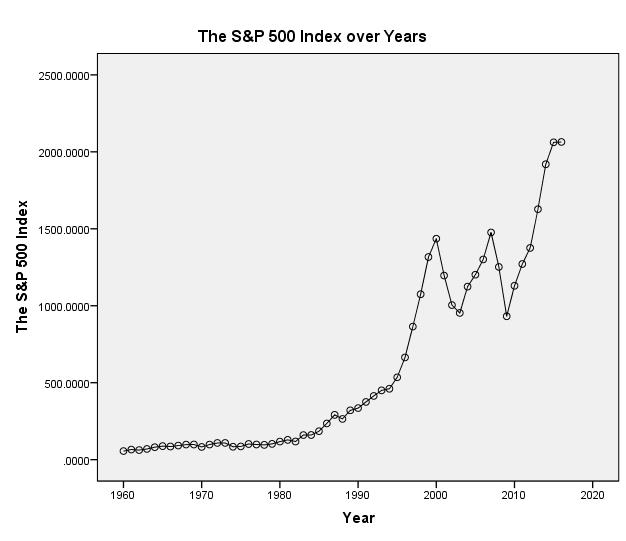
The data shows that both the US GDP and the S&P 500 have increased considerably over time. The US GDP increased from 0.5433 trillion dollars in 1960 to 18.569 trillion dollars in 2016. During the same period, S&P 500 index increased from 55.763 to 2064.201. Over the past 57 years, the US GDP is highly dispersed (M = $0.75 trillion, SD = $5.66 trillion) with the range of $18.026 trillion. The S&P 500 exhibits a slight dispersion (M = 79.359. SD = 599.152) with a range of 2008.44. The US GDP and the S&P 500 have a positive skew of 0.616 and 0.937 and negative kurtosis of -0.959 and -0.340 respectively. The positive skew shows the increasing trend of the US GDP and the S&P 500 index over the years.
Table 1.
Results
Figure demonstrates that the US GDP has been increasing exponentially since 1960. The trend of the US GDP suggests that economy has been performing well for the last 57 years with a slight decline during the global economic crisis of 2008.
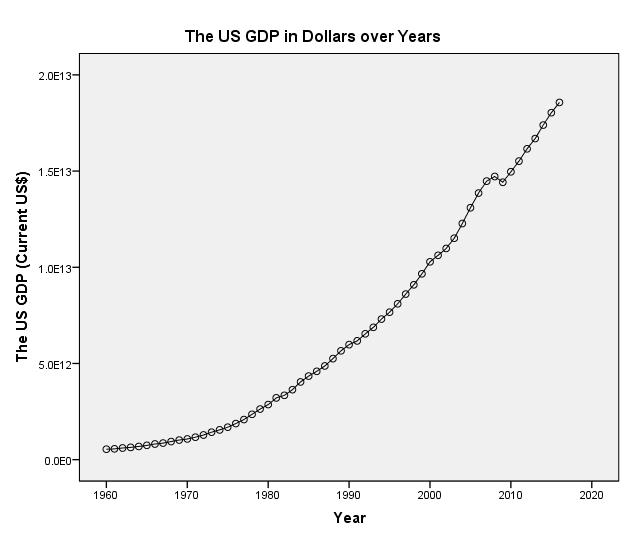
Figure 2 below shows that the S&P 500 index has been increasing exponentially up to the year 2000 when marked fluctuations occurred for 10 years before stabilizing.
The scatter plot below (Figure 3) illustrates that there is a positive relationship between the US GDP and the S&P 500 index. Given the nature of relationship that exists between the gross domestic product and the stock market, it is feasible that the S&P 500 explains the variation in the US GDP.
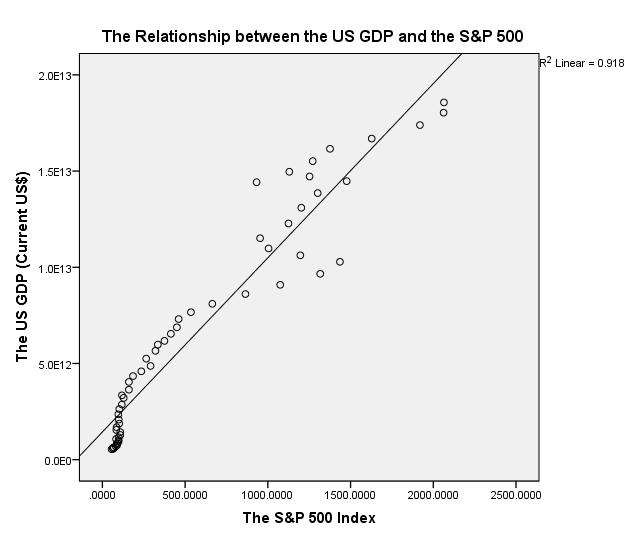
Correlation analysis (Table 2) confirms that the US GDP and the S&P 500 index have a very strong positive relationship that is statistically significant (r = 0958, p = 0.000).
Table 2.
Further analysis of relationship reveals that the S&P 500 index explains 91.8% (R2 = 0.918) of the variation in the US GDP.
Table 3.
The regression model is statistically significant in predicting the relationship between the S&P 500 index and the US GDP (F (1,5) = 615.495, p = 0.000).
Table 4.
The coefficients’ table below (Table 5) shows that the S&P 500 index is a statistically significant predictor of the US GDP as a unit increase in the S&P 500 index results in 9.055 billion dollar increase in the US GDP. The regression coefficients show that the US GDP is very sensitive to changes in the stock markets as measured by S&P 500 index.
Table 5.
Conclusion
Correlation analysis confirms that the S&P 500 index and the US GDP have a very strong positive relationship that is statistically significant (r = 0.958, p = 0.000). Further analysis using regression demonstrates that the S&P 500 index is a statistically significant predictor for it accounts for 91.8% of the variation in the US GDP. The findings are in line with the literature review for they support that stock markets influence economic activities that generate GDP in a country. Therefore, the study shows that S&P 500 index effectively predict the trend of the GDP in the United States as hypothesized.
References
Data: GDP (current US$). (2017). Web.
Masoud, N. (2013). The impact of stock market performance upon economic growth. International Journal of Economics and Financial Issues, 3(4), 788-798.
Plachy, R., & Rasovec, T. (2015). Impact of economic indicators on development of capital market. Finance, 3(18), 101-112. Web.
Standard and Poor’s (S&P) 500 Index data including dividend, earnings and p/e ratio. (2017). Web.