Introduction
The profitability of business is subject to numerous factors related to the production and marketing of goods or services. The number of employees in an organization reflects the production capacity and has a direct relationship with profits. Comparatively, revenue is an indicator of financial performance because it has indirect effects on profits. In their study, Mun and Jang (2015) established that cash levels and working capital are predictors of profitability because their interactions have synergistic effects. In essence, organizations with adequate cash levels and sufficient working capital tend to perform better and register higher levels of profits than companies with low levels of cash and working capital.
Heikal, Khaddafi, and Ummah (2014) report that financial ratios, such as current ratio, return on assets, return on equity, and net profit ratios, collectively determine profits in organizations. Since employees comprise a primary factor of production, the study expects it to have a stronger effect on profits than revenues generated by businesses. Therefore, the study seeks to collect and analyze data of 30 companies in New York to answer the research question that “Is a business’s profit more likely to be affected by the level of turnover the business generates or by the number of people it employs?”
Procedure
The study obtained data for analysis from the Internet databases because they contain updated, accurate, and verifiable information about companies. Since profits in companies vary from one country to another due to differences in external environments, the study selected companies in New York. The data of revenues, numbers of employees, and profits of 30 companies were obtained from an online database (Projects Newsday).
The companies were sampled randomly from the top 100 companies that traded in the stock markets in 2017 to ensure even distribution. The study removed companies with significant outliers in all variables and replaced them with others selected randomly. Therefore, as the study retrieved updated data of annual revenues, numbers of employees, and annual profits through random sampling, and further cleaned the data by removing outliers, it generated a reliable data for analysis and answering of the research question.
Method Analysis
The study utilized Minitab 17 in data analysis to determine the effect of annual revenues and the number of employees on annual profits of 30 companies selected. Correlation analysis aids in the determination of the strength of the relationship between variables. Regression analysis helps to establish whether the number of employees or annual revenue has a stronger effect on profits of the selected companies.
The theoretical background of analysis is that employees and revenues are predictors of profits in companies. The theory of causation requires the existence of a causal relationship between independent and dependent variables to warrant the analysis of effect (Sekaran & Bougie 2016). In this case, numbers of employees and the annual revenues constitute independent variables of the study, whereas annual profit is the dependent variable of the study.
Results
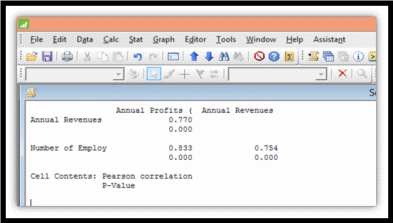
The findings of correlation analyses (Appendix B) show that there is a positive relationship between variables. There is a very strong relationship between the number of employees and the annual profits generated by companies (r = 0.833, p = 0.000). Comparatively, correlation analysis shows that the annual revenue has a strong and statistically significant positive relationship with the annual profit (r = 0.77, p = 0.000).
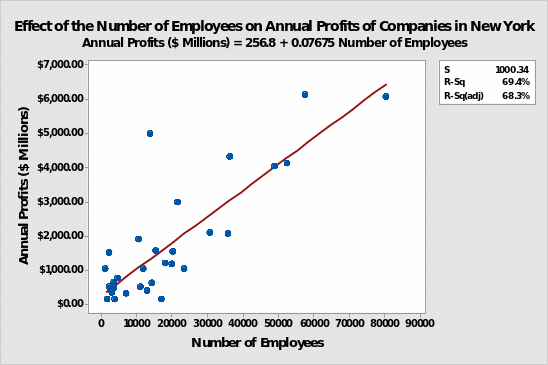
Regression analysis further demonstrates that the number of employees explains 69.4% of the variation in profits among companies (Appendix C). Coefficients of regression equation indicate that an individual employee increases profits of an organization by $76,750.
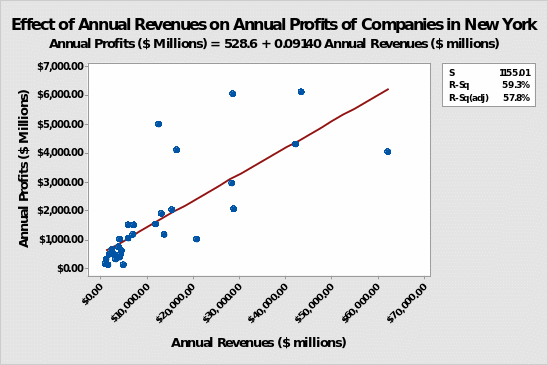
In comparison, annual revenue accounts for 59.3% of the variation in the annual profits of companies. According to the coefficients of regression, an increase in revenues by a million causes profits to increase by $91,400. Thus, the findings answer the research question by demonstrating that the number of employees has a stronger influence on profits among companies in New York than the annual revenues.
Critical examination of results indicates that they are in line with the expected outcome that the number of employees has a stronger effect on the annual profits than the annual revenues. Evidently, employees have a significant influence on the profitability of organizations because they are drivers of production and directly influence performance (Keynes 2018). On a broader sense, the findings imply that companies in New York majorly rely on human labor in the production of goods and services. For companies to attain commendable profits, they need to increase their capital in tandem with the number of employees and production units because they have direct effects on the profitability of organizations.
Conclusion
Both the number of employees and the annual revenues have positive relationships with the annual profits of companies in New York. However, the number of employees has a stronger positive relationship, accounts for more variation, and a more significant influence on profits than the annual revenue. Hence, the findings imply that human labor plays a considerable role in enabling companies to generate their profits.
Reference List
Heikal, M, Khaddafi, M & Ummah, A 2014, ‘Influence analysis of return on assets (ROA), return on equity (ROE), net profit margin (NPM), debt-to-equity ratio (DER), and current ratio (CR), against corporate profit growth in automotive in Indonesia stock exchange’, International Journal of Academic Research in Business and Social Sciences, vol. 4, no.12, pp.101-114
Keynes, JM 2018, The general theory of employment, interest, and money, Palgrave Macmillan, New York, NY.
Mun, SG & Jang, SC 2015, ‘Working capital, cash holding, and profitability of restaurant firms’, International Journal of Hospitality Management, vol. 48, pp. 1-11.
Newsday 2018, New York City’s Top Public Companies. Web.
Sekaran, U & Bougie, R 2016, Research methods for business: a skill building approach, John Wiley & Sons, New York, NY.
Appendices
Appendix A: Data
Appendix B: Correlation Analysis

Appendix C: Effect of the Number of Employees on Profits

Appendix D: Effect of Revenues of Profits

