Introduction
In this report, two competitor firms have been selected for review and analysis of their financial performance in the last three years (2015, 2016, and 2017). These companies are Apple Inc. (Apple) and Samsung Electronics Co. Ltd. (Samsung). Both companies hold a significant share of the electronics market specializing in computer and multimedia devices. Apple is a US-based company, whereas Samsung is Korea-based. Both companies compete in the highly competitive electronics industry. Both Apple and Samsung face significant risks of a substantial investment in research and development. The primary factor for the growth of these companies is the rising demand for hand-held electronic products, including smartphones.
The current report carries out a financial ratio analysis of both Apple and Samsung to evaluate and compare their financial performance in the last three years. It includes the calculation of financial ratios under four categories, including liquidity, efficiency, financial leverage, and profitability ratios. The weakness of this analysis is that the fiscal year-end of both companies does not match.
Company Profile of Apple and Samsung
Apple
Apple is a leading US-based company which has its headquarter in Cupertino, CA. Steve Jobs set up this company in 1976. The company mainly sells consumer electronic items, including smartphones, computers, and tablets, etc. Furthermore, it has a well-established division involved in software development. The company enjoys strong brand recognition and loyalty and is listed among the top companies globally based on its market capitalization. The total revenue of Apple was $229.23 billion in 2017 (Apple Inc.). The financial statements of Apple for the last three years are provided in Appendix A.
Samsung
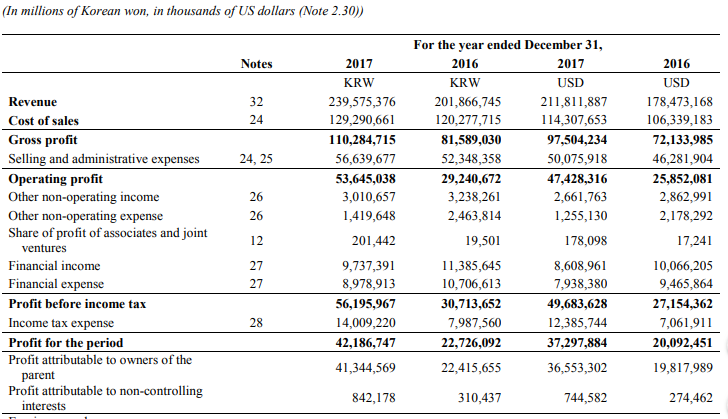
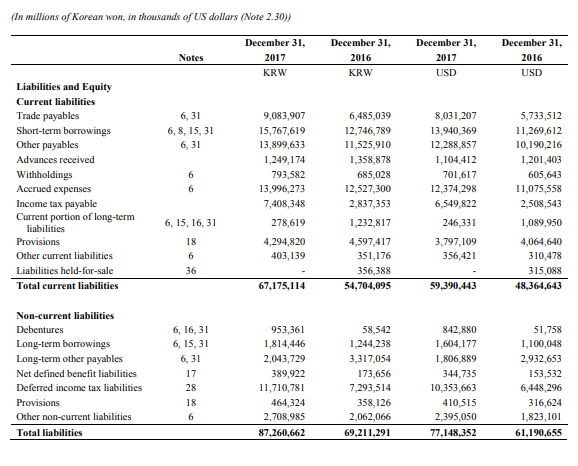
Samsung is a direct competitor of Apple and is located in Seoul, South Korea. It was established in 1938 by Lee Byung-Chul. The company not only manufactures products that are similar to Apple but also produces chemicals, automotive, and home appliances. Its total revenue was $211.81 billion in 2017 (Samsung). The financial statements of Samsung for the last three years are provided in Appendix B.
Trend Analysis
Appendix C provides key performance indicators of both Apple and Samsung. It is noted that Samsung’s financial performance excelled as its operating cash flow grew by 31.18% in 2017 (Samsung) as opposed to Apple, which reported negative growth of 3.38% (Apple Inc.). Although the cash position of Apple remained strong, Samsung surpassed its competitor. However, it did not manage its inventory efficiently as compared to Apple.
The primary reason for the increase in its inventory was the failure of one of its smartphone models in 2017, which resulted in the product recall. Both companies invested significantly in research and development in the last three years. Moreover, it could be noted that Samsung almost doubled its investment in the previous year as competitive forces played a crucial role, and less popular brands gained a higher market share in developing countries. On the other hand, Apple faced challenges relating to the increasing costs of developing new and improved technologies for its products in 2017 and also its inability to meet customer expectations resulted in negative growth of sales in 2016 (Apple Inc.).
Liquidity
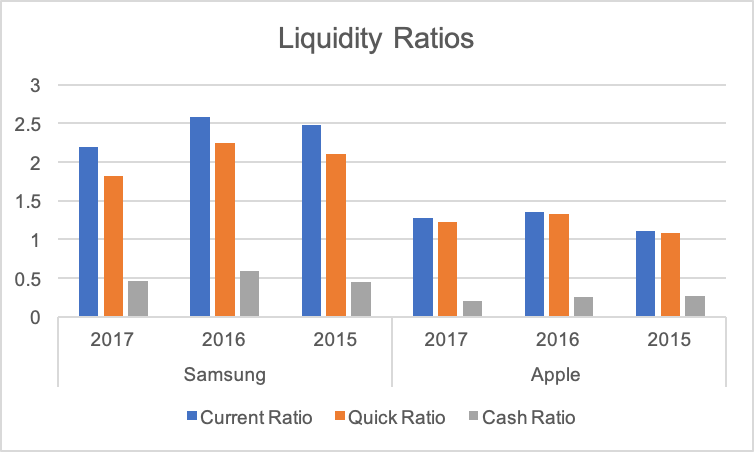
It is crucial for a business to maintain sufficient liquidity to keep its business operating and fulfil its current obligations. In this report, three critical ratios, including current, quick, and cash ratios, are calculated, and their values are provided in table 2 (see fig. 1).
Table 2. Liquidity Ratios of Apple and Samsung.
Current Ratio
It could be noted that the values of the current ratio of both companies declined in the last year. Moreover, its value remained more than one, which is the benchmark value. It is observed that the current liabilities of Apple increased in the previous three years due to high short-term borrowing and an increase in its current liabilities (Apple Inc.). On the other hand, Samsung reported current assets, which were more than two times its current liabilities. However, the increase in its current liabilities, including trade payables, was more than current assets (Samsung).
Quick Ratio
The values of the quick ratio also followed a similar declining trend. However, the quick ratio values of both companies were also above one in the last three years. Furthermore, it is clear that Samsung held more inventories than Apple. It could be stated that the company’s short-term strategies to increase sales and control its inventory did not work effectively (Samsung). On the other hand, Apple’s inventory almost doubled in the last three years, but its proportion to the current assets remained low (Apple Inc.). It was reported that increasing inventory was a major concern for the management.
Cash Ratio
The cash ratio values of Samsung were higher than Apple. The analysis shows that both companies had a strong cash position and were unlikely to face any financial problem, which is a crucial aspect of business efficiency. The reason was that Samsung’s cash position improved significantly in the last three years due to its strong position in the developing markets (Burris). The company benefited from the low cost of sales. On the other hand, Apple reported a decline in its operating cash flow.
Efficiency
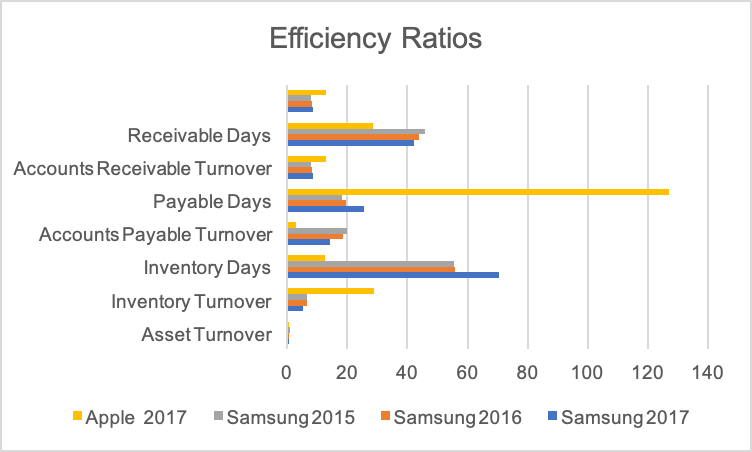
It is crucial for all businesses to achieve operational efficiency by managing their working capital and other assets efficiently. It helps them to control their costs and expenses and attain a competitive advantage. Seven efficiency ratios are calculated in this report, and their values are provided in table 3 (see fig. 2).
Table 3. Efficiency Ratios of Apple and Samsung.
Asset Turnover
The asset turnover of Apple declined in the last three years. The main reason for this change was the company’s substantial investments in acquiring other businesses and assets to achieve greater control and efficiency across its supply chain (Apple Inc.). On the other, Samsung sold its non-performing assets and acquired new assets that were expected to generate a higher return in the coming periods. The management decided to invest in both current and non-current assets to enhance its research and development and develop new technologies (Samsung).
Inventory Turnover and Days in Inventory
Apple was highly efficient in terms of its inventory management during the last three years as it was able to convert its inventory into sales quickly. It is noted that its inventory turnover declined significantly in that period as it faced the rising cost of sales and slow inventory movement (Apple Inc.). On the other hand, it is observed that the inventory turnover of Samsung remained low in the last three years. It was due to its inability to make quick sales. Moreover, the company’s strategy was to buy large quantities of supplies to keep its product prices low. It faced significant business problems in 2017 as one of its smartphone models had battery issues, and all sales were recalled (Samsung). The company took almost 70 days to convert its inventory into sales, which was a much more extended period than Apple.
Accounts Receivable Turnover and Days Receivable Outstanding
When both companies are compared, it could be indicated that Apple had higher accounts receivable turnover and a low number of days receivable outstanding (Apple Inc.). However, it is noted that the values of these ratios of Samsung improved in the last three years. The primary reason for the improvement in the company’s sales was its effective sales and marketing strategies. The customers were able to take advantage of pre-launch sales at low prices by paying for its products in cash (Samsung).
Accounts Payable Turnover and Days Payable Outstanding
The value of the accounts payable turnover of Samsung was higher than Apple. Although both companies reported a decline in the value of this ratio during the last three years, it is noted that Apple had a significant increase in its accounts payable. The reason was its effective working capital management strategies as the company maintained its strong cash position. Apple took 126 days to settle its supplier accounts (Apple Inc.), whereas Samsung only took 26 days (Samsung). It also implied that Apple had better-negotiated contracts with its suppliers, who gave it a more extended credit facility.
Financial Leverage
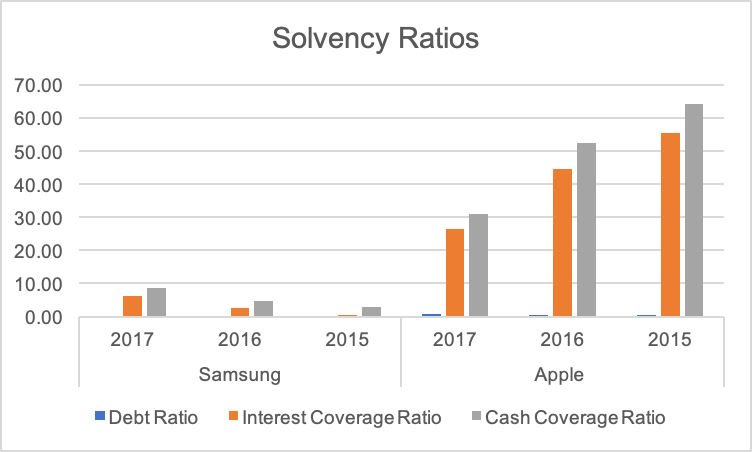
Companies manage their capital structure according to their needs for funding different business operations and investments. It is crucial for them to ensure long-term solvency to safeguard shareholders’ interest. In this report, three solvency ratios, including debt ratio, interest coverage ratio, and cash coverage ratio given in table 4 (see fig. 3).
Table 4. Financial Leverage Ratios of Samsung and Apple.
Debt Ratio
The values of the debt to equity ratio of Apple remained high in the last three years. It implied that the management took advantage of high debt to receive a tax benefit from the interest payment deduction. The high debt ratio of Apple means that the shareholders’ interest was diluted as the company faced a higher risk associated with the external debt. The management report of Samsung indicated that the company financed its new projects by borrowing externally. These projects were aimed at increasing its profitability and sustainability (Samsung).
Cash Coverage Ratio
The values of the cash coverage ratio of Apple were much higher than Samsung. It is also noted that its value declined significantly in 2017. The main reason is the high borrowing by Apple, which results in high interest expense. Furthermore, it is noted that the company’s earnings before interest and tax declined by almost 13% since 2015 (Apple). On the other hand, the value of the cash coverage ratio of Samsung improved during the last three years. The company managed to secure borrowing at low-interest rates. Moreover, its operating income increased by almost 300% as opposed to Apple.
Interest Coverage Ratio
The interest coverage of Apple reduced during the last three years, whereas Samsung considerably improved its position. In 2015, Samsung did not generate low operating income but had improved its earnings significantly in the previous two years. On the other hand, Apple did not have any problems, but its declining operating profit suggests that shareholders should be concerned about the company’s strategy and increasing product prices.
Profitability
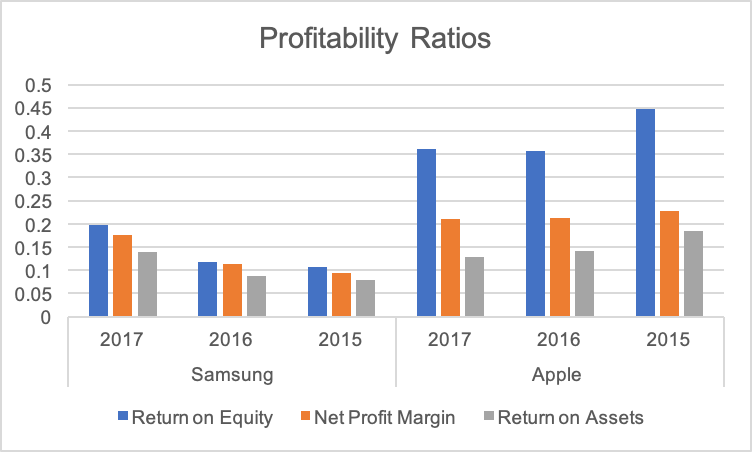
The primary objective of a company is to generate income for distribution to its shareholders. In this report, three key profitability ratios, including net profit margin, return on equity, and return on assets, have been calculated, and their values are provided in table 5 (see fig. 4).
Table 5. Profitability Ratios of Apple and Samsung.
Return on Equity
Apple generated a higher return on shareholders’ equity in the last three years as compared to Samsung. However, its net profit declined by 9.44% in the previous three years. There was a significant improvement in the net profit of Samsung in that period, and its total equity increased because of the increase in its retained earnings. It raises a concern whether the company was using its internal capital effectively or not. The cost-effective strategies of the company contributed to the growth in its earnings (Samsung).
Net Profit Margin Ratio
The net profit margin for Samsung increased from 9.5% in 2015 to 17.6% in 2017. On the other hand, the ratio value of Apple slightly reduced in the same period. The increase in revenue of Samsung and its low-cost strategy helped it to earn a higher profit margin (Samsung).
Return on Assets
The Return on Assets of Apple declined in 2017, whereas Samsung reported an increase in its value. It means that Samsung was more efficient to use its assets for generating higher income as compared to Apple.
Conclusion and Recommendations
It could be concluded that Apple excelled in the last three years. There were areas of concern indicated in this report as the company suffers from a decline in the demand for its expensive products. However, its financials remained strong, and it is expected to grow in 2018 with its new products. On the other hand, Samsung continues to control the majority of the electronics market. Its profitability has improved significantly over the last three years. It is concluded that the company needs to work on its business management and product strategies to challenge Apple in the developed markets. Based on the analysis provided in this report, it is recommended that investors should buy shares of Apple to receive regular dividends and achieve a capital gain.
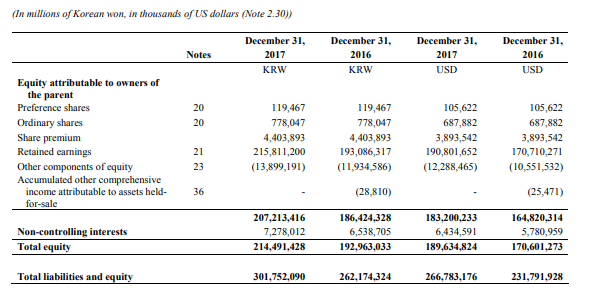
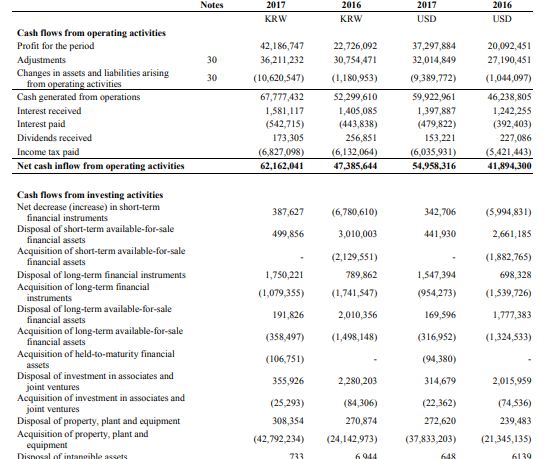
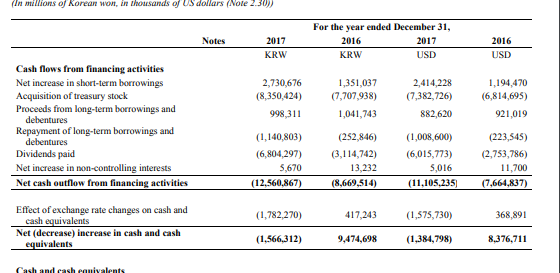
Appendix A – Samsung Financial Statements
Appendix B – Apple Financial Statements
Appendix C – Key Performance Indicators
Works Cited
Apple Inc. “Apple Inc. Annual 10K Report 2017.” Apple. Web.
Burris, Matthew. “The History of Samsung (1938-Present).“. LifeWire. 2018. Web.
Samsung. “Samsung Annual Report 2017“. Samsung. 2017. Web.