Introduction
Apple Inc. is a multinational technology entity that is based in California, the U.S. It has presence across the globe. The company employs about 115 thousand people. Besides, it has over 470 stores in about 17 countries. The company focuses on the production of both computer hardware and software products. It also offers online services and manufactures a variety of electronics. The key products that are sold by the company are Mac, iPod, iPhone, iPad, Apple Watch, and Apple TV among others. The target market comprises of young children, teenagers, college and university students, business people, and adults. The highest consumption is recorded between the ages group 24 and 35 years. Apple, Inc. is a public company that was established in 1976.
The operations of the company cut across several industries. Therefore, the corresponding NAICS codes are 334111, 334113, and 334220. Further, the key competitors are Microsoft Corporation, Samsung electronics inc., and Amazon Inc. The company is listed on NASDAQ with the ticker symbol AAPL. Besides, it is a component of NASDAQ-100, DJIA, S&P 100, and S&P 500. The shares of the company are currently trading at $119.57 with a beta of 1.42. The earnings per share currently stand at 8.31. From the 2016 annual report, the total sales amounted to $215.639 billion while the net income was $45.687 billion. The value of total assets was $321.686 billion.
Analysis of balance sheet
This section will focus on analyzing the sources and uses of funds over a period of three years. The company makes use of both debt and equity. The horizontal analysis shows that debt accounted for 50% of total capital in 2013. This proportion dropped to 25% in 2014 and later rose to 31% in 2015. A further review of the balance sheet shows that the retained earnings make a significant proportion of shareholder’s equity. Further, the total shareholder’s equity was constant during the three year period. In terms of usage, long term assets account for the largest proportion of total assets. The company has made a huge investment in long term marketable security (51%), short term marketable security (13%), and property plant and equipment in (8%) over the period analysis. Analysis of the percentages shows that the company has invested heavily in securities. The amount of investments is justified by the industry in which the company operates and the balance of retained earnings. The analysis of the balance sheet is displayed in exhibit 1 below.
Analysis of income statement
A review of the common size income statement shows that the proportion of the cost of sales to net sales ranged between 59.94% and 62.38%. Further, selling, general, and administrative expenses accounted for the highest percentage of operating expenses ranging between 6.13% and 6.56%. The proportion of research and development grew from 2.62% to 3.45%. The provision for income taxes also grew from 7.68% to 8.18%. The distribution for the operating expenses resonates well with the company because the company operates in a highly dynamic industry. A further review of the income statement shows that the company is profitable. The net profit margin grew from 20.32% in 2013 to 21.75% in 2015. The common size income statement and trend analysis are shown in exhibit 2.
Trend analysis
Trend analysis shows that the total current assets dropped in 2014 (-6.49%) and improved in 2015 (30.42%). The total long term assets grew by 22.13% in 2014 and 23.14% in 2015. Further, it can be noted that the total assets rose by 12% in 2014 and 25.29% in 2015. The total liabilities dropped by 37.87% in 2014 and later increased by 42.26% in 2015. There was no change in shareholder’s equity during the three year period. In summary, the balance of the company grew over the three year period.
The revenue grew by 6.95% in 2014. It further rose by 27.86% in 2015. The net income also increased by 8.14% in 2014 to 35.35% in 2015. The analysis shows that there was a growth in revenue and net income. Trend analysis for balance sheet and income statement is shown in Exhibits 1 and 2 respectively.
Analysis of the cash flow statement
A review of the cash flow statement shows that the biggest source of cash for Apple Inc. is operating activities. The biggest uses were in investing activities in 2015 and financing activities in 2013 and 2014. In 2013 and 2014 the company generated enough cash to finance both investing and financing activities from operating activities. However, in 2015, the cash generated from operating activities was not adequate. The net decrease in cash was $607.7 million. A summary of the cash flow statement is presented in exhibit 3.
Return ratio analysis
The return ratios give information on profit generated from the use of equity, assets, and financial leverage. The value for return on equity rose from 31.77% in 2014 to 140.64% in 2015. The two values were higher than the industry average of 29.59%. This shows an improvement in inefficiency in the use of shareholder’s equity to generate profit. Return on assets also grew from 52.96% in 2014 to 64.37% in 2015. It shows improvement in the use of assets to generate profit. The ratio for the company was better than the industry average of 15.61%. Finally, return on financial leverage grew from (21.19%) to 76.27%. The values were higher than the industry average (46.5%). Thus, the analysis shows that the return ratios for Apple Inc. grew. This can be attributed to the increase in the value of net income. A summary of the ratios is shown in exhibit 4.
Profitability ratio analysis
Profitability ratios show the earning capacity of Apple Inc. The gross margin rose from 38.59% in 2014 to 40.06% in 2015. This shows that there was an improvement in pricing and the cost of sales. Besides, the values were higher than the industry average of 29.32%. The profit margin rose from 20.54% in 2014 to 72.66% in 2015. The company performed better than the industry (3.89%). This significant growth can be attributed to growth in both sales and a slight decline in some expenses. It also shows that the efficiency in managing both operating and non-operating activities of the company improved. Finally, the ratio of expenses to sales dropped from 9.87% to 9.58%. This indicates that expenses grew at a slower rate as compared to sales. The values are lower than the industry average which currently stands at 18.91%. The three ratios show that the profit level rose. The profitability ratios are summarized in exhibit 5.
Liquidity ratio analysis
The liquidity ratio gives information on the ability of the company to settle immediate obligation using short term assets. The current ratio dropped from 1.93 to 1.70 between 2014 and 2015. The values are lower than the industry average of 2.06. The quick ratios were low and they deteriorated from 0.26 in 2014 to 0.22 in 2015. This is lower than the industry average of 1.35. The operating cash flow to current liabilities was constant at 0.02. This value is lower than the industry average which currently stands at 0.31. Thus, the company has a low liquidity position. The ratios are presented in exhibit 6.
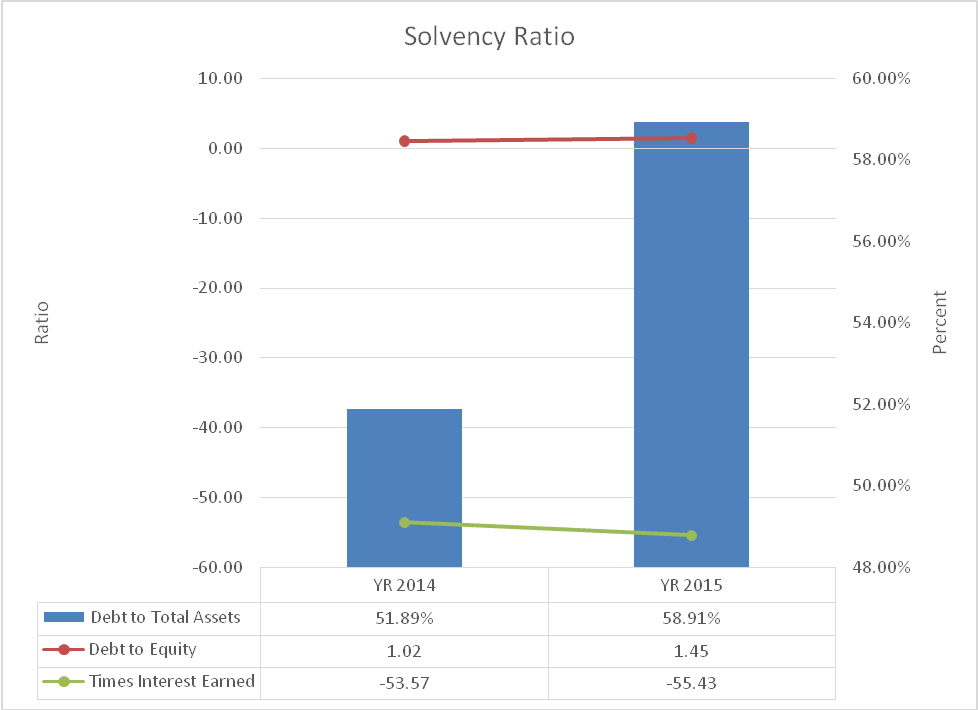
Solvency ratio analysis
The solvency ratios give information on the proportion of debt and equity financing and the ability of the company to pay interest expense. The proportion of assets that are financed by debt grew by 51.89% in 2014 to 58.91% in 2015. It shows an increase in the amount of debt. Secondly, the debt to equity ratio rose from 1.02 in 2014 to 1.45 in 2015. The values are lower than the industry average which currently stands at 37.03. It also shows that the amount of debt increased. It is apparent that the leverage level increased. The time’s interest earned ratio rose from 53.57 in 2014 to 55.43 in 2015. The value is higher than the industry ratio of 27.67. This can be attributed to growth in operating income and it indicates that the solvency level improved. The ratios are summarized in exhibit 7.
Conclusion
The trend analysis above shows that the financial performance of the company is improving. Also, there was growth in return ratios. The profitability of Apple Inc. rose. The ratio analysis above further indicates that the company has a low liquidity level. Finally, the leverage level rose while the solvency of the company rose.
Exhibits
Exhibit 1
Exhibit 2
Exhibit 3
Exhibit 4
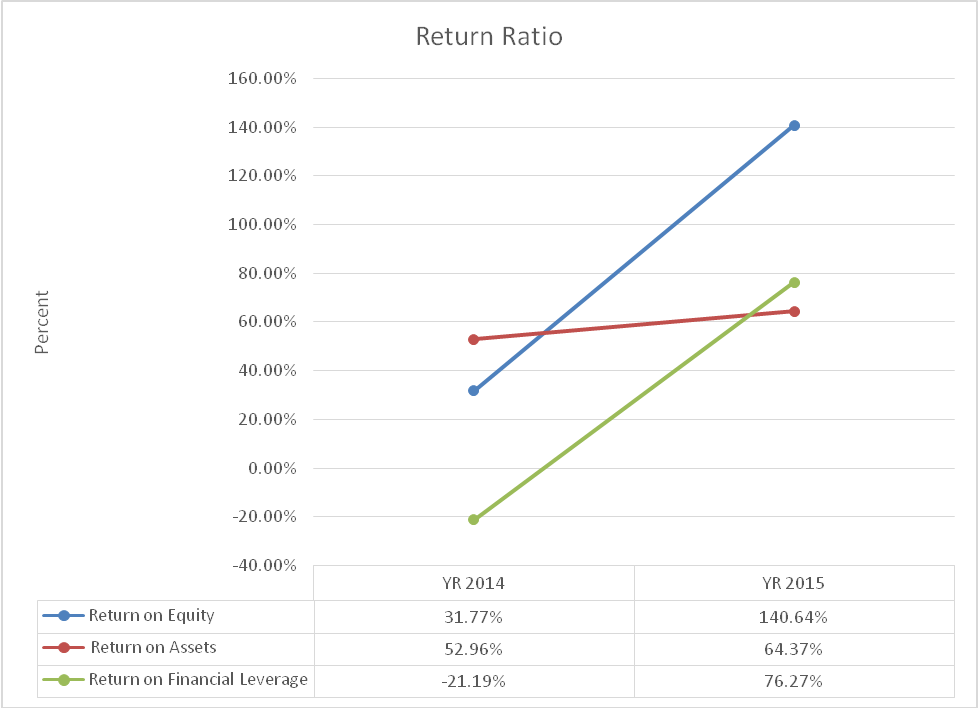
Exhibit 5
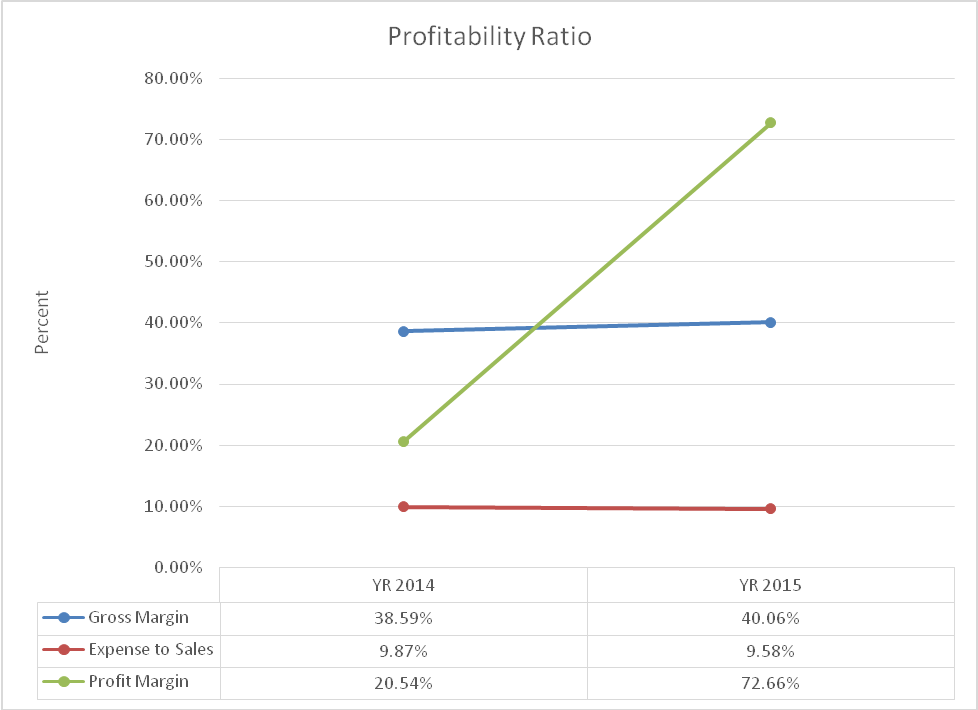
Exhibit 6
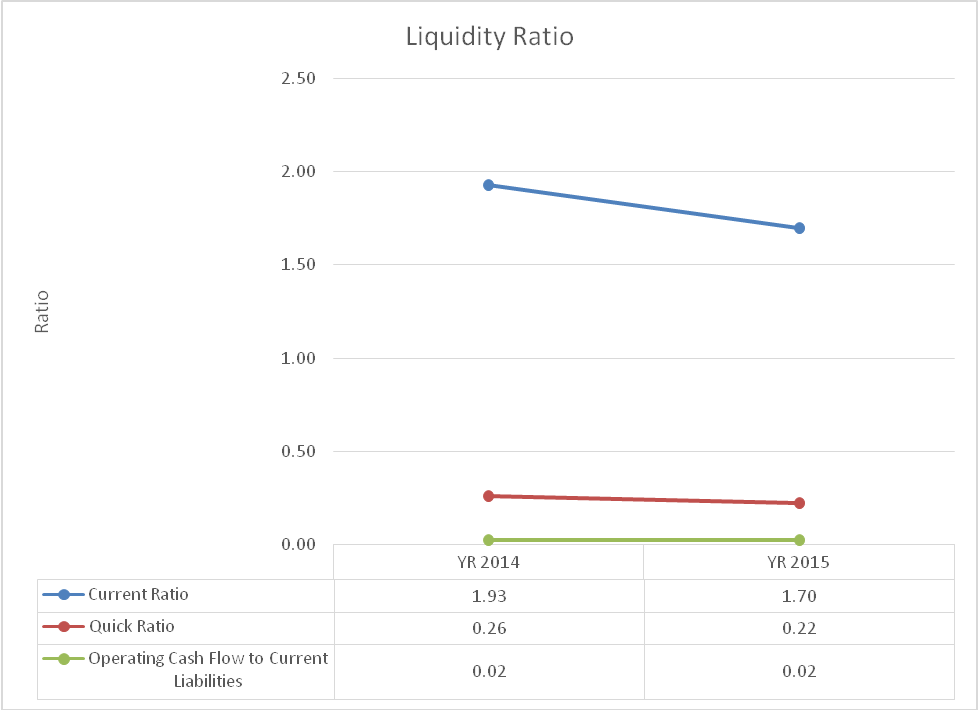
Exhibit 7