Selection of a Company
United Kaipara Dairies Company PSC (UNIKAI) Company operates in the agricultural food processing industry. This company has been in existence for over three decades and specializes in dairy products. I have always had a special interest in working in the production department of this company, especially in the QC. Due to its expansive strategies, the company has featured as one of the most successful food processing companies in Dubai. Besides, the company is facing interesting opportunities for growth due to the expansion of its customer base.
Choice and background of the company
The table below show the contact information of the company.
UNIKAI, based in Oman, was formed 11th April 1977. It is located on the Arabian Peninsula, United Arab Emirates. The company was formed through a pronouncement of the ruler of Dubai. The gap in the provision of a wide range of pasteurized dairy products created the need to form a dairy company hence the formation of UNIKAI. The primary line of business of the company is to offer daily products such as ice cream, frozen desserts, milk packing, yogurt, and chilled dairy products among others. The company has also diversified into another secondary line business that is, for imports of dry food products for resale in the United Arab Emirates Products of the company are sold both in the domestic and international market. In recent years, the company has been audited by Klynveld Peat Marwick Goerdeler Corporation (KPMG).
UNIKAI is a publicly-traded company in the Dubai Financial Market PJSC with a ticker symbol – UNIKAI. The Chief Executive Officer of the company is Mustafa Sidiki. The chairman of the board is Obaid Al Mulla and the vice-chairman is Ali Al Owais. Other board members are Humaid Al Tayer, Ousama Seddiqi, Ali Al Shamsi, and Mohammed Sualeheen. In addition, the total number of employees of the company is 1,582. The main subsidiary of the company is Unikai and Company LLC. It holds 100% equity in the company.
Overview of the annual report
Financial highlights in the balance sheet
From the table above, there was a decline in the amount of total current assets and total non-current assets. The number of current liabilities declined while total non-current liabilities increased. Also, the total amount of stockholders’ equity declined.
Financial highlights on the income statement
From the above table, the total operating revenue and cost of sales increased Total expenses before tax declined. The non-operating gains increased. Finally, earnings per share declined.
Financial highlights on the statement of cash flow
From the above table, only net cash flow from operating activities declined while rest increased.
The company fillings
All companies in all countries are expected to file the registration statements of the company, periodic reports and other standard forms. Examples of forms filed by UNIKAI are F-1 (registration statement of the company), S-1 (General form of the registration statement), 10-Q (quarterly reports), 10-k (Annual report), 8-K (interim report) and 11-K (annual report of employee stock purchases and savings). Out of all the reports filed by the company, the most useful reports are 10-Q (quarterly reports), 10-k (Annual report), and 8-K (interim report). These reports are of major concern for the stakeholders of the company. Besides, these reports show the contribution of the company to the economy of the United Arab Emirates.
Operating activities
The operating activities of the company the past two years
From the table, the company net financial results declined in the two year period. Further, the company had other incomes which originated from the sale of scrap, foreign exchange gains and proceeds on the sale of property, plant and equipment. The company did not have any extraordinary gains or losses, income from discontinued operations or the cumulative effect of accounting changes during the years.
The table below shows the income from operating activities and net income from the continued operations of the company for the past two years.
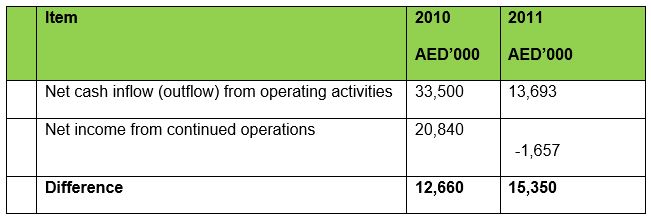
From the table, cash flow from operating activities exceeds the net cash flow from continued operations. It is attributed to the fact that cash flow from operating activities eliminates the financial transactions which do not involve actual movement of cash such as depreciation, impairment of assets, and provision for tax. Further, cash flow from operating activities takes into account the working capital changes such as changes in inventories, trade and other receivables, trade and other payables, the effect of related parties and employee terminal benefits. This is the major cause of the difference pointed out above.
The table below shows the balances of net account receivable and inventory for the two-year period.
From the table, it is evident that there was a decline in both net accounts receivables and inventories. Both net account receivables and inventories declined.
Accounting methods used
Revenue from the sale of goods is measured at the fair value of the consideration received or receivable fewer returns and allowances, trade discount and volume rebates. Further, the revenue is recognized in profit or loss after transferring a considerable amount of risk to consumers. Inventories are valued at a lower cost and net realizable value after taking into consideration obsolete and slow-moving items. Finally, accounts receivables are initially measured at fair value. Costs attributed to the transactions are added to the fair value.
Analyzing of operating activities
The table below shows values of various ratios for the two year period
From the table, it is evident that the company had a decline in profitability as shown by a decline in gross profit, operating profit and net profit margin. Return on total stockholders’ equity also declined due to the decline in profitability. However, the level of activity of the company increased as shown an increase in activity ratios such as receivable turnover, inventory turnover and asset turnover.
Investing activities
The table below shows an analysis of investing activities of the company.
The percentage change shows that the company had a decline in non-current assets at the end of each year. The percentage decline for plant property and equipment for 2011 was greater than 5%. This was attributed to the decision by the company to dispose of transportation and distribution equipment. It was done in accordance with the management decision to dispose of commercial vehicles which were lying idle.
The table below shows the proportion of noncurrent assets to total assets.
The proportion of non-current assets to total assets is fairly stable over the two years at 38.26% in 2010 and 39.89% in 2011. A company should tie a reasonable amount of resources into non-current assets because they are used to facilitate the generation of income. The proportions above show that the company holds a reasonable amount of non-current assets.
Analyzing of investing activities
The table below shows the rate of return on total assets of the company.
The two approaches to measuring return on total assets show a decline in return on assets during the two year period. The cash flow approach gives higher values than the accrual basis. The accrual basis is more indicative of the financial performance of the company than the cash flow basis because it takes into all changes in investing. Cash flow basis only takes into account only changes that are accompanied by cash flows. From the ratios above, it is evident that the company generates dismal returns from the use of assets of the company. The ratios could also show that the company has been undertaking expansion and modernization by disposing of old assets and acquiring modern equipment. An analyst needs to look at the fixed asset movement schedule to be able to verify with certainty the investing activities of the company.
Debt financing
The table below summarizes the debt of the company for the past five years.
The current liabilities increased in 2010 thereafter it declined in subsequent years. In 2008 and 2009, the company did not have long-term liabilities. The long-term liability reported in 2010 and 2011 were the employees’ terminal benefits. The company relies on bank overdraft, trade and other payables, and amounts due to related parties for debt financing. Further, the company does not have any contingent liability.
Equity financing
The table above shows the financing activities of the company. Other than the information shown in the table, it is also important to note that 27,500 shares were issued for considerations other than cash.
Analyzing financing activities
From the review of the liabilities of the company and the stockholders’ equity, it is evident that the company uses more equity financing than debt financing. This implies has low leverage. There has been no material change in the capital structure of the company other than the introduction of employees’ terminal benefits. Further, the company does not have any long-term outstanding long-term notes or bonds payable. The table below shows various ratios for the company.
Comparison with industry benchmark
Reflectively, the net profit margin is above the average of 4.7% in this industry. Besides, the equity ratio as a proportion of the financial performance falls within the 4.8 mark of this industry. In addition, the gearing of this industry has a potential growth of 4.7 % annually which is almost the same gearing of the industry. Moreover, the company has been consistent in the production frontier and currently controls over ten percent of the segment industry. Conclusively, the financial performance of this industry is geared to sustainable growth with debt to equity ratio below 2.8.