Brief Background Information
Founded in 2006 and headquartered in Stroudsburg, PA, the group, ESSA Bancorp, Inc., is a financial company incorporating two subsidiaries ESSA Bank & Trust and ESSA Advisory Services LLC. The financial holding company is a fully chartered savings association currently led by Gary S. Olson, the group’s Chief Executive Officer. Its clientele include non-governmental organizations, established and emerging businesses, families, and individuals. The company’s main line of business is taking of deposits from its clients, and using the deposits and any other generated income to invest in various viable opportunities such as home equity loans, consumer loans, real estate loans, and mortgages. Its other services include asset management, insurance advisory, and investment services.
Financial Ratios Analysis
An in-depth analysis of the company’s ratios is only possible if the ratios are categorized and each category discussed separately as they have varied impacts on a firm’s position. In this regard, we will start by analyzing the firm’s basic financial ratios. We begin with the analysis of the company’s return on assets.
Return on Assets ![]()
2011 = 5,258 /1,097,480 =0.0048
2010 = 4,512/1,071,997 =0.0042
Considering the two years financial performance, we find out that the company’s return on assets has increased from 0.0042 in 2010 to 0.0048 in 2011. This means the management’s efficiency at using the company’s assets to generate income increased. Every company’s asset has been put to good use to generate more income for the stakeholders, which is a good indication.
Debt to equity ![]()
2011 = 935,801 / 161,679 =5.788
2010 = 900,374/ 171,623 =5.246
The company’s debt to equity ratio has increased from 5.246 in 2010 to 5.788 in 2011, which is an indication that the company has been actively involved in securing debts to fund its operations. A continued increase in debt to equity ratio can lead to volatile earnings. This is because the company will spend more in paying off borrowed funds, which their interests fluctuate easily. As a result, investors are left with little or no money to share as dividends in the end.
ROE=Net Income/Shareholder’s Equity
2011 = 5,258 /161,679 =0.0325
2010 = 4,512/171,623 =0.0263
The company’s return on equity has increased from 0.0263 in 2010 to 0.0325 in 2011. This means that the company has been able to use its available equity capital effectively to earn more income. A high return on equity is indicative of the ability of available equity capital to attract more money for the firm, hence increasing shareholders’ earnings. However, this ratio is low as compared to industry leader RHG.AX, with 31.53% ROE.
Profit margin = Net Income/Revenue
2011 = 5,258/7,121 =0.7384
2010 = 4,512/6,356 =0.7099
The company’s profit margin increased from 0.7099 in 2010 to 0.7384 in 2011, which is indicative of increased effectiveness in the conversion of sales into profits.
Working Capital Analysis
Besides the basic financial ratios already discussed, there are supplemental operating asset management ratios, which are crucial to understanding the financial position of a firm. Financial analysis of any firm cannot be considered conclusive without the analysis of these ratios.
Working capital is of great importance to investors, ESSA investors alike. The ratio is of great importance to investors since it estimates or establishes the length of time it takes when cash is tied up in easily convertible or current assets. Any organization, ESSA included, that hopes to attract and retain investors, must maintain low operating capital.
ESSA’s cash flow from operating activities gives crucial information about the company. In 2009, the company’s cash flow from operating activities was 9,566,000(Appendix 2). In 2010, the figure dropped to 7,417,000, in 2011 however, the figure shot up to 10,188,000. In the three financial years, the company has been posting positive results; however, the worrying trend is the inconsistency of the firm. Since cash flow from operating activities is what pays for company bills, the fluctuation could send mixed signals as to the ability of the firm to pay its bills and make profits. Since the company has not registered negative results, we could say it is still on the right financial track.
ESSA’s cash flow from investing activities shows a different trend. The firm’s 2009 results showed -38,749,000; in 2010, the results remained negative at -38,664,000; however, in 2011, the firms posted positive results in three years of 4,084,000. The negative results could be construed to be the losses the company is making from its investments. However, a closer scrutiny reveals high investment tendencies in those years. As given in appendix 2, the company invested 37,713,000 in 2009; 36,088,000 in 2010, and only 10,190,000 in 2011.
Cash flows from financing activities have been steadily decreasing over the last three years. In 2009, ESSA registered 35,162,000, in 2010, the value dropped to 23,544,000, and in 2011, it posted 16,532. The decrease could be attributed to dividends payment. However, the company’s dividends issue has not been consistent with the decrease in cash flows from financing activities, casting doubt on the firm’s real potential and going concern. For instance, in 2009, dividends were 2,397,000, in 2010, 2,577,000 while in 2011, dividends dropped to 2,315, but cash flows still dropped too.
Major investments in last 5 years
On July 31, 2012, ESSA closed an “acquisition deal of Firsts Star Bancorp, Inc.” (Marketwatch, 2012). By acquiring First Star Bancorp, Inc., the company spread its operation base to encompass nine business centers in the Lehigh Valley. Consequently, the company expanded its customer base by taking the customers initially served by First Star Bancorp, Inc.
The company also consolidated its stock offering in 2007. As a result, it attained gross proceeds of $158.7 million. This followed the sale of 15,870,000 ordinary shares to the general public at a price of $10.00 each. The sale of these shares provided the much needed funds to drive the company’s investment ventures.
Other areas of investment over the last 5 years include investing in mortgages to finance the housing needs of people while at the same time earning a lot of money. In fact, the company’s mortgage business is now very established and earning a lot of money.
Financial Structure Analysis
The company’s balance sheet, found in Appendix 3, shows the capital structure of the firm. The company’s debts, long and short term, have been varying yearly. Its short term debts, for instance, were valued at 438,598,000 in 2009, the figure then dropped to 350,076,000 in 2010 before finally hitting 288,410,000 in 2011. This is a steady and significant decrease in the company’s short term debts. Considering the volatility of the interest rate of short term debts, the company’s move to narrow these debts is in the right direction.
The cash flow statement provides crucial information on the company’s capital structure. The continued rise in the value of cash flow from investing activities has been directly attributed to increase in earnings from investments. For instance, in 2009 where the cash flow from investing activities was – 38,749,000, the company earned -37,713,000. This is an indication that earnings from investment form the backbone of the company’s overall performance.
The cash flows also show a consistent trend in dividends issue. In 2009, the company issued 2,397,000 in dividends, in 2010, the company issued 2,577,000, while in 2011it issued 2,315,000 (ESSA Bancorp, 2012). Over the three years period, the company’s net earnings have been different. In fact, from the company’s annual income statement attached in appendix 1, the company posted a net income of 5258, 4512, and 6556 in 2011, 2010, and 2009 respectively. Therefore, the dividends issue is a deliberate plan to plough back profits and to cut down on debts.
In conclusion, the decision to invest in a company requires consideration of many factors. However, the most important factor remains the ability of a firm to maximize shareholders’ earnings. At the present situation, ESSA does not confidently present a financial background solid enough to convince potential investors to put in their money in the company.
The company’s return on equity is a mere 0.13% currently, against its main competitor’s 31.53% (RHG.AX). This means that when the company gives back only 0.13% for every amount of money invested in it, RHG.AX will return 31.53%. This represents a significant difference, which can tilt the tides against the firm.
Its annual dividend yield stands at 2.00% against the industry leader, UCBA’s 7.00% and industry average of 2.40%. this is one indication that investing in the company could result in earning less as compared to people who invest in other companies.
The company’s 2011 earnings per share is another reason for caution when investing in the company. The company posted earnings per share of 0.02, the second lowest among the top ten competitors in the industry gains the industry average of 0.56 (Yahoo finance, 2012).
Lastly, the company’s net income is not consistent. Therefore, investors cannot be certain of any earnings. For instance, in 2009 the company had net of 6,655,000, in 2010; it dropped to 4,512,000, in 2011, however, the earnings improved to 5,258,000.
Appendices
Appendix 1: ESSA Company Financials: Annual Income Statement (values in 000’s)
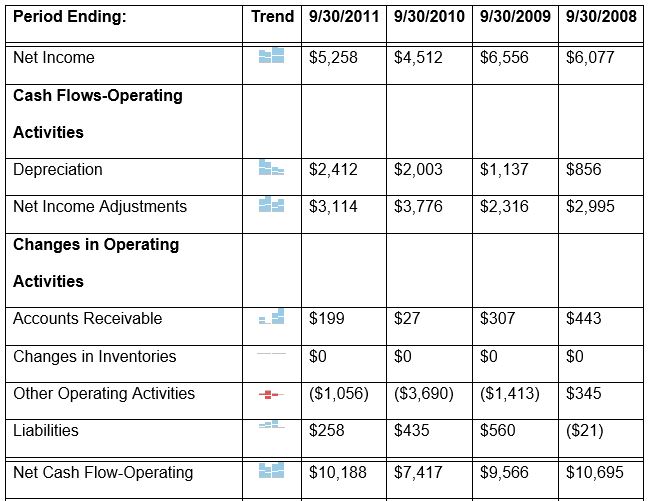
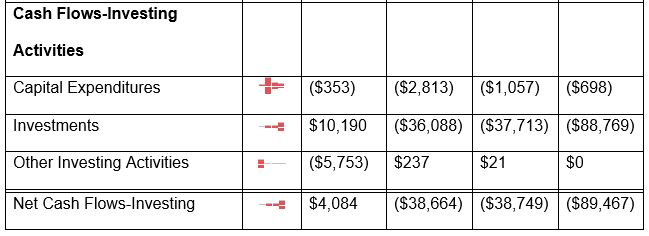
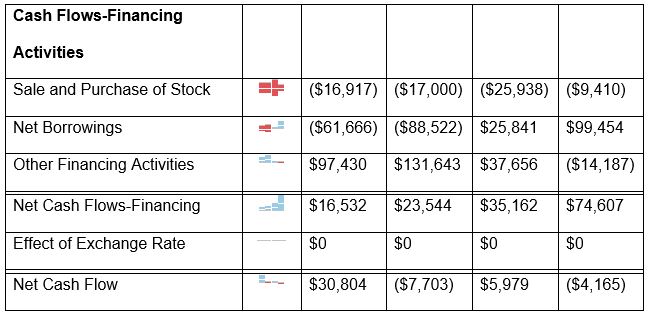
Appendix 2: ESSA Bancorp, Inc. (ESSA) Cash Flow
Appendix 3: ESSA Bancorp, Inc. (ESSA) Balance Sheet
References
ESSA Bancorp. (2012). ESSA Bancorp Inc. Annual Report. Stroudsburg, PA: ESSA Bancorp.
Marketwatch. (2012). ESSA Bancorp, Inc. Announces Closing of First Star Bancorp, Inc.Acquisition – MarketWatch. MarketWatch – Stock Market Quotes, Business News, Financial News. Web.
Yahoo Finance. (2012). ESSA Industry: Savings & Loans | ESSA Bancorp, Inc. Stock – Yahoo! Finance. Yahoo! Finance – Business Finance, Stock Market, Quotes, News. Web.