Stock and Trak Report
Stock market trading involves taking risks of spending money on stocks, bonds, and futures. By not fearing investing in the stocks market, the class assignment group learned more about the operations of the bond and stock system. As a result, the group strategy was to spend all money in the simulation account to buy stocks, bonds, and futures. Investing in futures earned short-term investment profit. On the other hand, long-term investments earned long-term profit.
The group targeted investing 80% of cash in shares, 10% in bonds, and the remaining 10% in the futures (Stocktrak). This clearly shows that the group preferred investing most of its capital in stocks rather than bonds, despite the higher risk involved as a way of attaining higher earnings. Moreover, group members of a younger age influenced the groups lack of fear when trading. The shock of getting losses when the prices of bought stock deteriorated could therefore have little effect on their health. Besides, investing 10% in futures assured the group of some quick profits from the short-term investment (Stocktrak).
From the various tactics employed by the group in its trading, investing in stocks was the approach that worked best while futures investment was the worst venture. All stocks bought by the group performed well with the highest stocks of Best Buy Co Inc, making a spectacular percentage increase of 8.12%, and the lowest of BlackBerry Limited, which made an increase of 0.56%. On considering the futures, the company Gold 1 UZ AUG 13 made a decrease of 1.55%, which was a loss. For bonds, their investment made no profit or loss at 0.00% (Stocktrak).
What affected the group investment strategy was the lack of saving for future investments. The group invested the entire amount of money by following past market trends, and as trading continued in the market, not only did some of the stocks with poor past records improve, but new stocks with promising future earnings emerged. Moreover, we relied on the past market information which provided unreliable forecasts on the futures because it was hard to determine the changes in the federal funds rate.
Moreover, the group made a poor sentinel forecast regarding the futures. The group undervalued the futures contract price in an insufficiently liquid market. The group expectations were that the spot prices would continue rising and the futures contract price would remain low. Moreover, the groups calculation on volume and price action was opposite to what occurred. When the group calculated the sentinel of the futures, it seemed to reach its bottom. Hardly did the group know that the futures sentinel was to continue its downward trend to the end of the contract leading to a loss.
Best Buy Co., Inc. Company Analysis
History and Economic Overview
Gary Smaliak and Richard M. Schulze founded Best Buy Inc. Company in 1966 as a single audio store. Today, the company has more than 2,400 subsidiaries worldwide. Meanwhile, considering the recent companys management, the CEO has changed from Brian J. Dunn to Hubert Joly (Best Buy).
Besides, Best Buy Co., Inc.’s power rests on the management since the board remunerated the retiring CEO highly so that the shareholder felt it was more than deserved. The decision regarding the remuneration was quick without approval from the interim manager who was powerless. The management is therefore the highest beneficiary from the success or fall of the firm (Best Buy).
With the departure of the former executive and the coming of the new one, the company performance has, however, started to change its downward course attributed to expansion strategies employed in 2010. The management of the firm led the company to fatal expansion in Europe where the firm opened a branded superstore with more than 200 stores as a joint venture with Carphone Warehouse. Currently, the firm is regaining the former strength it had financially to impressive annual profit margins. With improved annual profit, the investors and the stocks market operators are confident in the firms abilities, as backed up by coupon bond rating upgrades of CC to BB (Morningstar).
Firms Financial Market
According to Morningstar, Best Buy Co., Inc., has 99 institutions and 1,238 individual owners. In percentage, the institutions own 11.13% of the company, individuals – 42.41%, and insiders – 0.30% (Morningstar). In order to compare the company against its competitors, Apple Inc., Walmart Stores, and Amazon Inc., the table below is adduced (Yahoo Finances).
In order to calculate the shares worth of Best Buy Co., Inc., the group employed dividend discount model. The discount dividend model helped determine whether the share price is undervalued or overvalued (Hanwa).
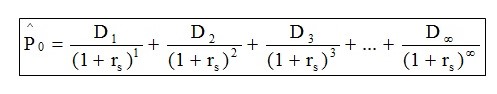
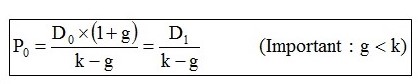
However, in our case, the company shares are to grow continually, hence the formula:
Whereby,
- D= the dividend at period n
- r= the rate of return or weight average cost of the capital
- s =time
- k=growth rate
As noted in NASDAQ, Best Buy Co., Inc. last paid a dividend of $0.17 per share to its shareholders (NASDAQ). According to Gurufocus, the company is growing at 2.5% at a discount rate of 5% (Gurufocus).
Share price =![]()
From the share face value of $31.23 and the share trading price of $27.09, the group concluded that the companys share is at discount (Yahoo Finances). To confirm the undervaluation of the companys share, the companys share prices are decreasing. The possible cause of the decrease in the share prices of Best Buy Co., Inc. is the declining share prices and sales in the associate companies such as Netfix Inc, NFLX, and CONN (Hanwa).
On the other hand, the investors willing to buy the company shares at the current price will have a low possibility of making losses taking into account that the shares’ price is below their face value. If the group was to advise investors, the investor should wait until the share price gets lower since they are on a downward trend (Hanwa).
Works Cited
Best Buy. Annual Report, 2013. Web.
Gurufocus. Best Buy Co Inc. Forward Rates of Return, 2013. Web.
Hanwa. What is the Intrinsic Value of a Stock? Investopedia, 2013. Web.
Morningstar. Best Buy Co Inc, 2013. Web.
Stocktrak. Global Portfolio Simulation, 2013. Web.
Yahoo Finances. Best Buy Co Inc., 2013. Web.