Introduction
The Coca-Cola Company is a multinational company that trades in soft drinks. It has presence in over 200 countries. The profits earned in the fiscal year ended June 2011 were embedded on a number of financial strengths these are, effective advertisement, diversity of products, and consistency in the rate of production. PepsiCo, created 1965, is a multinational company that trades in beverage and food. PepsiCo was formed after a merger between Pepsi-Cola Company and Frito-Lay. The company is incorporated in the United States and it trades on the New York Stock Exchange. It has presence in over 200 countries. The net revenue for the company totaled to $43.3 billion in 2012. As at 2011, the company had 297,000 employees. A strong brand name and aggressive advertisement were the key factors that contributed to the increased sales. It is worth noting that the financial meltdown affected profitability of some outlets for the two companies (Hayes 2009, p. 1). The paper compares financial performance for the year 2011 of Coca Cola Company and PepsiCo using the profitability, gearing level, efficiency, investor, and liquidity ratios. Finally, it gives recommendations to a potential investor.
Profitability
An organization measures performance through financial and non-financial attributes. A reliable approach that can be used to determine the performance of a company over a period is through measuring its profitability (Troy 2009, P.62). Basically, the difference between the revenues from selling products to consumers and the costs associated with producing and delivering such products gives profits. Two ratios are used to measure profitability in this analysis these are, gross profit margin and return on capital employed. The gross profit of Coca Cola Company was 50.11% (appendix 3), indicating that half of the sales revenues were utilized in the acquisition of raw materials for the production of the output.
The net operating margin ratio is a superior ratio for measuring profitability of a company. Through this approach, it is clear that Coca Cola had a stronger position at 23.06% than PepsiCo which had net profit margin of 14.48%. The return on capital employed compares the net incomes with the total capital utilized in the generation of profits.
Efficiency
Efficiency ratios show the ability of the organization to generate profits from the use of available capital. The efficiency in use of capital can be measured using turnover ratios and rate of repayment of existing liabilities. Examples of turnover ratios are creditor’s payment and debtors’ collection period in days. The ratios indicate the frequency in days with which credit purchases and sales are paid.
Companies seeking to have adequate cash flows reuire the longest period to pay creditors (Troy 2009, p. 75). This help them to utilize the funds in revenue-generating activities before relinquishing the funds. The ability to have a long repayment period depends on the bargaining power of the creditors and the company’s credit policy. A company policy that is unfavorable to the creditor’s leads loss of good will and suppliers flight (Troy 2009, p. 79). It is therefore imperative for an organization to understand the needs of its creditors before coming up with a repayment period. The Coca-Cola Company had 42-days for a creditor payment period while PepsiCo had 47 days (appendix 3). The ratio is linked to the current ratio. Current ratio measures the availability of finances for short term obligations. An organization with a low current ratio relies on creditors, and has a longer creditor payment period. The debtor collection period for Coca-Cola Company was 38 days while PepsiCo had 37. The stock turnover also measures levels of efficiency of an organization. Stock turnover for Coca-Cola was 57 days while PepsiCo had 41 days.
Liquidity
Liquidity measures the availability of funds to finance operations in the short and long-run. Organizations have operational requirements and financial needs. Therefore, there is need to have adequate cash flow to ensure that all obligations are fulfilled. Short term liquidity is measured through the current ratio. This ratio compares the current assets and liabilities (Gibson 2010, 97). The Coca-Cola Company had a current ratio of 1.1 (appendix 3). The value of 1.1 shows that current assets are able to cover current liabilities. It is a favorable ratio. Another ratio is the acid test ratio. It provides a refined approach to testing liquidity. It eliminates the inventory from current assets. It is reliable since some components of stock are slow moving and not necessary liquid assets. Coca-Cola had an acid test ratio of 0.97 while PepsiCo had 0.98. Based on this measure, both companies have similar liquidity position. A high current ratio is detrimental to the performance of the company, since it indicates that there is a high opportunity cost that results from idle resources. Companies with a current ratio below 1 face liquidity challenges. Liquidity is closely linked to profitability. Organizations with favorable liquidity levels rarely face challenges with profitability. It is because inventories are moving constantly to generate revenue (Gibson 2010, 97).
Gearing Ratios
Coca-Cola Company finances its operations through debt and equity capital. The relationship between debt and equity capital determines the gearing level. A high gearing level is favorable during recovery because high profits are improved through fixed rates of return (Gibson 2010, p. 99). However, if creditors are not satisfied with the ability of the organization to meet long term obligations, then it becomes necessary to exercise their options to recover their resources. The gearing ratios show the ability of an organization to honor long term obligations. The ratio of the finances accruing to the owners and those accruing to the creditors determines the gearing level of an organization.
Coca-Cola has a gearing ratio of 20% (appendix 3). At this level, the company faces no risk of takeover from the creditors. Actually, the company has an opportunity to increase its gearing level without experiencing any challenges if need be. An increase in the gearing ratio affects the profitability ratio, since the increase in capital provides additional finances for operations. As a result, the gross profit grows. However, the net capital employed declines since an increase in the denominator (capital employed) might not be adequately compensated in the numerator (net income). Increase in long term capital leading to an increase in gearing causes a rise in the interest expense. The interest expense lowers the quality of profits (Gibson 2010, p. 101).
Investor Ratios
The earnings accruing to organizations are usually destined for the creditors, owners and other stakeholders. Earnings per share measure the amount in dollar value which is attributable to each outstanding share. Shareholders are interested in achieving growth in their investment (Bull 2007, p. 33). Coca Cola had an earning per share of $4.08 (appendix 3). This implies that the profits from the operations were $4.08 for each share in the capital structure. Earnings per share are closely linked to profitability and the gearing level. Companies which are profitable are bound to have high earnings per share, unless the gearing level is high. If the gearing level is high, then most of the earnings will be attributable to the creditors.
Dividend per share indicates the amount in dollar value, which is distributed to shareholders. Earnings are normally distributed to the shareholders in revenue or capital terms. Capitals distribution of earnings is done through retained earnings thus leading to capital growth. Organizations with a favorable current ratio find it possible to distribute profits, since the company has sufficient cash flows to handle current obligations. Companies with a low gearing ratio can also distribute earnings through dividends since they experience no challenges accessing debt and equity capital. The ratio is related to the profitability levels, since organizations can only pay dividends when the company makes profits.
Share price divided by earning per share gives the price earnings ratio. Organizations with impressive long term performance tracks have high price earnings ratios because the market price of the shares grows depending on the level of earnings. Price earnings ratio is also closely linked to the market to book ratio per share. A high market to book ratio per share is determined by the demand for such shares in the secondary markets. Shares which are highly demanded have a high market to book ratio because high demand pushes the prices upwards.
Conclusion
Coca Cola has achieved impressive performance and growth over the years. As a global leader, the company commands a high level of goodwill from suppliers and loyalty from customers. Creditors have also found it economically viable to work with the company. As a result, the profitability, liquidity and the gearing level of organization is within a favorable range. Investors have also benefited from associating with Coca Cola through the existence of capital and revenue gains. From the analysis, financial performance (in terms of profitability, efficiency, and returns to investors) of Coca Cola Company is better than that of PepsiCo. With regard to liquidity and gearing, both firms are at the same level. An investor should observe the trend of performance for additional years before committing funds into the company.
References
Bull, R 2007, Financial Ratios: How to use financial ratios to maximize value and success of your businesses, Elsevier.
Gibson, H 2010, Financial Reporting and Analysis: Using Financial Accounting Information (Book Only), Cengage Learning, California.
Hayes, J 2009, Coca-Cola Television Advertisements, Nation’s Restaurant News, New York.
Troy, L 2009, Almanac of Business and Industrial Ratios 2009 Almanac of Business & Industrial Financial Ratios, CCH.
Appendices
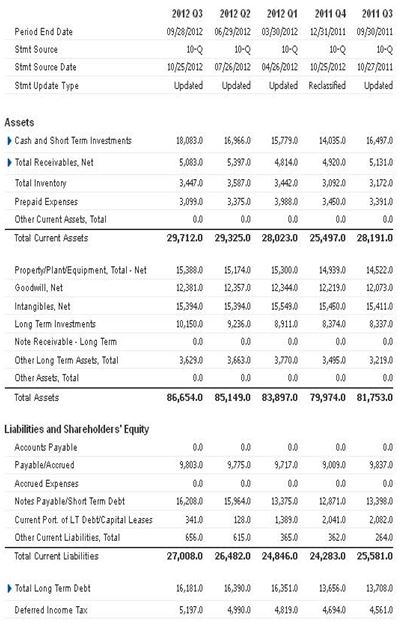
Appendix 1: Balance Sheet
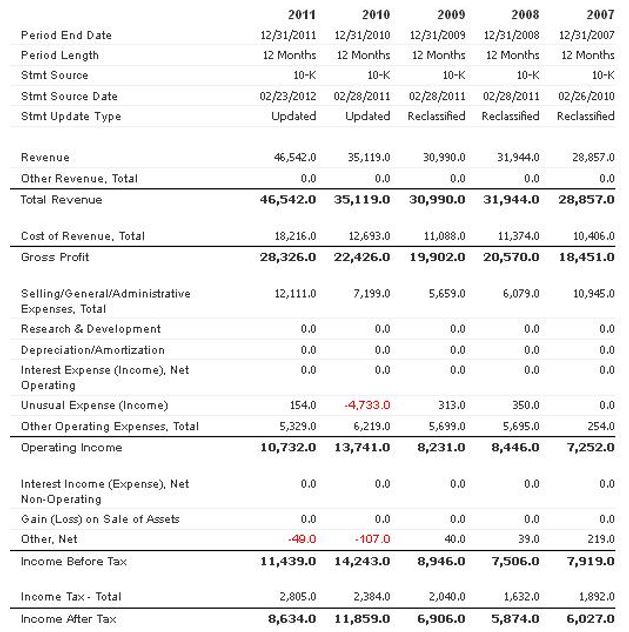
Appendix 2: Income Statement
Appendix 3: The Ratios
Profitability
Return on capital employed
(Net) Operating Profit x 100 = %
Capital Employed
PepsiCo: (9633/57797) *100=16. 67%
Coca Cola (10732/59646) *100=17. 99%
Gross profit margin (%)
Gross profit x 100 = %
Sales
PepsiCo: 34911 / 66504 =52. 50%
Coca Cola: 28326 / 46542 =50. 11%
(Figures in millions)
3. (Net) Operating profit margin (%)
Operating Profit x 100 = %
Sales Revenue
PepsiCo: 9633 million/ 66504 million=14. 48%
Coca Cola: 10732 Million/ 46542 million=23. 06%
Liquidity
Current ratio
Current assets = no. of times
Current liabilities
PepsiCo: 19720/16220=1.89 times
Coca Cola: 29712/27008=1.10 times
(Figures in millions)
Acid Test Ratio
Current assets (excl. Stock) = no. of times
Current liabilities
PepsiCo: 15815/ 16220=0.98 times
Coca Cola: 26265 /27008=0.97 times
Efficiency
Capital Turnover ratio
Sales Revenue= no. of times
Capital Employed
PepsiCo: 66,504/57797=1.15 times
Coca Cola: 46542/59646=0.78 times
(Figures in millions)
2Stock Turnover (in days)
Average Stock x 365 days
Cost of Sales
PepsiCo: (3599/31593)*365=41 days
Coca Cola: (2871/18216)*365=57 days
Efficiency
Debtors Collection Period (in days)
Trade Debtors x 365 days
Credit Sales
PepsiCo 🙁 6912/66504)*365=37 days
Coca Cola: (4920/46541)*365=38 days
- (figures in millions)
4 Creditors Payment Period (in days)
Trade Creditors x 365 days
Credit Purchases
Pepsi Co: (4083/31593)*365=47 days
Coca Cola: (2172/18216)*365=42 days
Gearing
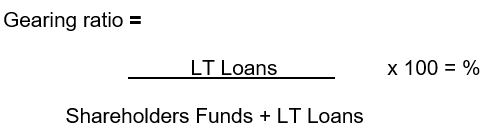
PepsiCo: 20568 /(20568+40,316)*100=33.78%
Coca Cola 13656/(13656+53550)*100=20.31% (Figures in Millions)
Earnings per Share
Profit after Tax (available to shareholders)
No. of Shares Issued
PepsiCo: 8,572 Million /4658 Million=1.88
Coca Cola: 6443 Million/1576 million =4.08
Dividend per Share
Dividend= £s or pence per share
No. of Shares Issued
PepsiCo: 3192 Million /1597 Million=2.03
Coca Cola Inc.: 4300 Million /4646 Million=0.94
Dividend Yield
Dividend/Share x 100 = %
Market Price/Share
- Pepsi Co: 2.03/65.06=3.12%
- Coca Cola: 0.94/ 33.25=2.81%
Price / Earnings Ratio
Market Price/Share = No. of times
Earnings/Share
Pepsico: 65.06/4.03=16.14
Coca Cola: 33.25/1.88=17.79
Book Value per Share
Net Asset Book Value = £s or pence per share
No. of Shares Issued
PepsiCo: 74,017 million / 1576 Million =46.97 per Share
Coca Cola: 86,654 Million/ 4568 Million=18.97 per Share
Market to Book Ratio
Market Price/Share = No. of times
Book Value/Share
PepsiCo: 65.05/13.14=4.03 times
Coca Cola: 33.45/4.9=6.83 times