Introduction and profile
Wm Morrison Supermarkets plc is considered to be the fourth biggest food retailer as it has 403 stores in the United Kingdom; the store’s customers get fresh food which is of high quality at great prices (Morrisons, 2011). This is because the store processes its own fresh food which is then sold through its outlet stores; this enables the firm to maintain high quality products which has enabled it to become a specialist in the industry. This gives the store a competitive edge over its competitors as more customers are attracted to it. Wm Morrison Supermarket attends to 9 million clients in any given week; the supermarkets’ employees serve the client and ensure that they add value both to the customer and the supermarket; through competitive prices and prompt attendance to clients (Morrisons, 2011).
The interim report (2010/2011) states that, the firm was able to increase its turnover to 8.1 billion, an increase of 9.1% from the 2009 fiscal year and the store’s profit before tax was £410 million, compared to 359 million in 2009 which is a 14% increase (Morrison, 2011).
This paper is a report which will consist of several parts which will explain the financial performance of the establishment for the last 5 years. It will include profitability, investment, liquidity and efficiency ratios. Finally, the report will give some conclusion and recommended question that the Chief Executive will be expected to answer during the presentation.
Financial analysis of Wm Morrison Supermarkets plc
The financial year 2006 as reported by the annual report was challenging for the Wm Morrison Supermarkets; during this year (2206) the company established a strong foundations by establishing more stores national wide that was aimed at sustaining the company in the near future. This strategy has renewed the company strength and the year turnover was £12,114.8m; in the financial year 2010 total turnover was £15,410m which is an increase of 27.2% from the year 2006 (Morrisons, 2011). The analysis identified profitability, investment, liquidity and efficiency ratios as the major parts of the analysis of the annual reports; regardless of bad economic conditions such as the global financial crisis, the consolidated income statement of 2006 to 2010 financial years is as presented in the table 7.1 where the turnover increased by 27.12% for the period between 2006 to 2010 (Morrisons, 2011). This means that it has been increasing from year to year as well as the earnings before tax which increased by 374.21% in the same period. The consolidated balance sheet of Wm Morrison Supermarket Plc has also been summarized through the use of ratios. Table 7.3, 7.4, 7.5 and 7.6 represent ratios that show a positive trend for the financial years 2006 to 2010.
Profitability ratios
Profitability ratio measures the management effectiveness as shown by the turnover generated on sales and investment (GoldmanSachs.com, 2011). This means that if a firm can be able to make a profit it will be able to meet its short term obligations and also pay dividends to its owners. The major ratios in this category include; net profit margin, gross profit margin, return on capital employed, operating profit margin, and operating expenses ratio. Table 7.3 presents Wm Morrison Supermarkets Plc profitability ratios, from these ratios it can be observed that in the year 2010 the turnover and gross profit had increased compared to the previous years (2009, 2008, 2007 and 2006) (Morrisons, 2011). It also shows a rise in profitability throughout the 5 years; as a result, Wm Morrison has increased its size of operations by means of increasing its operations such as increase in turnover facilitated by rise of credit sales (Morrisons, 2011).
The profit margin in 2008 for instance had increased with a high rate compared to 2007 but which then narrowed in 2009 as a result of increased expenses. In 2010 the performance improved as the net profit margin widened; table 7.3 gives a summary of the 2010 gross profit margin of Wm Morrison Supermarket which was 6.89 for a pound of sales. The return on shareholders’ equity steadily increased from year 2006 to 2010, this was as a result of high increase in sales in the financial year 2010. The operating expenses reduced significantly as more sales were made but the decline may also be attributed to the economies of scale that the company achieved by producing fresh food in high volumes and selling the products to the customers (Morrisons, 2011). After paying tax on the profit earned by the company, the fiscal 2009 showed a totally different picture as it deviated from an increasing trend, but in 2010 the shareholders earnings after tax increased tremendously (Morrisons, 2011).
Investment ratios
These are ratios that are used to calculate the overall performance of the company; they are used to determine the company’s dividend policy, the effect of a proposed financing option on the company and also to predict the effect of rights issue (Microstrategy.com, 2011). The investors can use investment ratio to determine the theoretical value of company’s securities and ascertain whether the securities are overvalued or undervalued (Microstrategy.com, 2011)
The low value of price earnings ratio (P/E) as presented by Table 7.4 implies that the Wm Morrison Supermarket Plc has negative investors for the future. According to Wm Morrison annual report (2009) the dividends paid were higher than the prior years and 2010; this means that the company retained more earnings for growth in the future. Growth of sales has actually resulted to increased earnings per share, which then triggered the share price increase (Morrisons, 2011). The shareholders’ earning in the fiscal 2010 were more than 2009 to 2006 financial years as the earnings covered dividend with a high of 3.88, meaning that for every pence paid to shareholder earnings were 3.88 times. The market price of shares when compare to earnings generated by the company, showed a higher ratio in the financial year 2010
Liquidity ratios
Liquidity ratios measure the firm’s ability to meet its short term maturity obligation as and when they fall due; they measure liquidity risk of the firm, where by the lower the liquidity ratio the higher the liquidity risk and vice versa (Meir, 2008). The Wm Morrison liquidity ratios as presented in table 7.5 are not very high. This implies that the short term obligations are not covered fully; for a full cover the ratio has to be at least one. In the year 2010 for instance, Wm Morrison liquidity ratios have decline compared to 2009 which incidentally had the highest ratio when compared to rest of the years (2006, 2007, and 2008) (Morrisons, 2011).
The quick ratio and current asset ratio have slightly decreased in the financial year 2010 which indicates that the firm has more debt owing to suppliers of goods and less credit sale in addition to the fact that it does not keep more stock on what can be sold (Morrisons, 2011). This information is bad news to shareholders who are waiting to receive dividends as they have no priority over the debt owners. On the other hand the long term debt was efficiently covered by shareholders’ equity. The debt ratio decreased from financial year 2006 to 2008 but increased in 2009 as result of increase in long term debt in 2009 financial year (Morrisons, 2011).
In 2010, the ratio decreased as result of repayment of some long term debts; the earning covered the interest or finance cost 15 times in 2010, implying that the company can efficiently pay the finance costs to the debt owners. The increase in the interest cover ratio may be as a result on increase in earnings and reduction in long term liabilities.
Efficiency ratios
Efficiency ratios measure the efficiency with which a firm uses its assets to generate turnover; they are also known as activity ratios/ turnover ratio since they indicate the rate at which assets are converted into sales (Drake, 2009). These ratios show how efficiently a company has managed its short term asset and long term liabilities (Drake, 2009). A balance of the Company’s sales and its assets reflects that the assets are well managed; but Wm Morrison Supermarkets is not efficient in its operations as it takes more days to convert inventory into sales. As presented by Table 7.6 it can be seen that, in 2010 the Wm Morrison supermarkets takes 15 days to sell the available stock (Morrisons, 2011). This implies that the Wm Morrison Supermarkets Plc has idle inventory in the warehouse compared to the prior years; it also shows that there is low demand for company’s products. While in 2009 and 2008 the numbers of days were constant at 13 days implying that the closing stock was almost the same for both years, in the year 2006 and 2007 the inventory days were almost the same (Morrisons, 2011). The turnover covered the fixed asset, this means that the assets are well managed in production of more goods for sale and a ratio of 2 in 2010 implies that for every pound spent on fixed assets 2 pounds are made. From the financial year 2006 to 2010 the company has added its fixed asset meaning that as fixed assets increases more sales are produced.
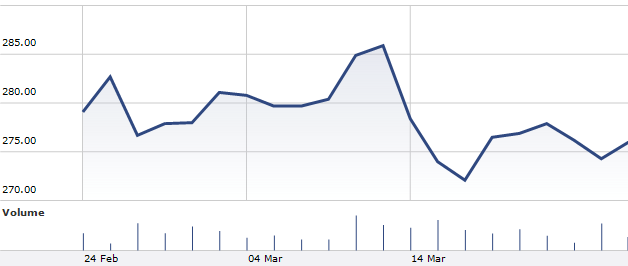
A brief analysis of the company shares prices over the last 4 to 6 weeks
According to Morningstars news of Wm Morrison, in 24th February 2011, the shares were doing very well as the price increased from 279.20p with a volume of 3.9 m to 282.80p in 25th February (Morrisons, 2011). But they reached the peak and started to drop meaning that the shareholders were selling off their shareholding rights which reached a minimum price of 276.80p with a trading volume of 15m; at this price the market became what the specialists describes as “bullish”. (Hemscott, 2011).
The store Preliminary Results Announcement of 10th March 2011 for the year ended 30th January 2011 greatly influenced the shares performance; therefore, the prices rose from a low of 276.80p to 285.00p on the release date with a volume of 19.2m (Hemscott, 2011). On 11th March there was a 1p change in share price to 286.00p and a drop in trading volume to 14m. The shareholder sold their shares leading to a price decrease of a low of 272.20p on 16th March. Then the market started to be bullish again (Hemscott, 2011).
Tesco plc and J Sainsbury Plc operate in the same industry as Wm Morrison (Food and Drug retailers), but J Sainsbury offer additional services such as property investment and financial services (Morningstar, 2011). The share prices of the three companies moved in the same direction, although Wm Morrison showed much fluctuation in share prices as a result of Preliminary Result Announcement; Wm Morrison, Tesco and J Sainsbury share prices dropped by 3.10p, 12.90p and 31.20p respectively within 24th February to 24th March 2011 (Morningstar, 2011).
Conclusion and Recommendations
Regardless of the global financial crisis, Wm Morrison has improved its performance over the five years; in real sense, high profitability is possible, the company’s operation efficiency and investment is realistic but liquidity deserves more attention in the future. This means that this will leave the management team to determine the means through which they will improve the Wm Morrison Supermarkets Plc liquidity. This may be achieved by good management of current assets and current liabilities as the company can increase cash and cash equivalent by investing in government treasury bills, money market and also maintaining more cash in hand and bank (Morningstar, 2011).
It can also improve its credit policy through selling more inventories on credit to the customers which will eventually increase sales; increase in sales increases the profitability ratios, investment ratios, liquidity ratios and efficiency ratios (Morningstar, 2011). The Wm Morrison earnings per share will increase indicating how much returns the shareholders and potential investors are expecting to earn from their shareholding in the company. The share prices will also go up when the turnover increases and this will eventually increase capital gains for speculators and dividends for the investors.
Since the Wm Morrison Supermarket Plc debt ratio is low, it means that the company’s asset can effectively cover long term obligations which pose higher risk to the Wm Morrison Supermarket. Taking into consideration all the above analysis, the recommendation is that Wm Morrison Supermarket Plc is a good investment to undertake.
References
GoldmanSachs.com. 2011. BRICs. Web.
Hemscott.2011. Company summary, Web.
Howells P. and Bain K. (2007), Financial Markets and Institutions, Web.
Meir, L. 2008. Financial ratio analysis, Web.
Microstrategy.com. 2011. Financial Analysis, Web.
Morningstar. 2011. Morningstar Stock Report™. Web.
Morrisons. 2011. Financial Reports. Web.
Pamela P. & Drake.2009. Financial ratio analysis, Web.